
Chart Elements
FlexChart is composed of several elements as shown below:
 |
||
|---|---|---|
 |
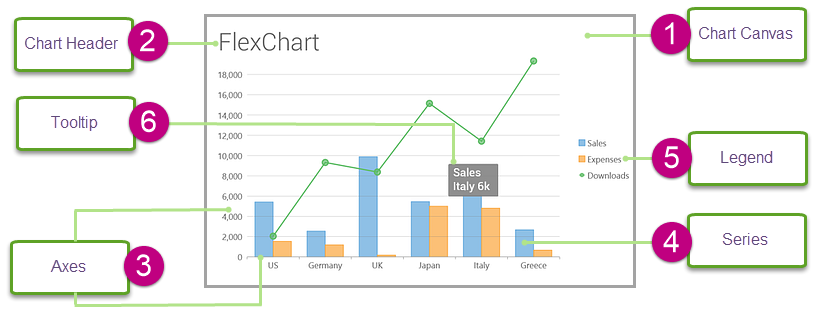
Chart Canvas | Area on which all chart elements including the series, axes title and legend are placed. |
 |
Chart Header | Text that you want to display at the top of your chart, basically a title that serves as a heading for your chart. |
 |
Axes | Two primary axes, X and Y. Although in some cases you may add secondary axes as well. |
 |
Series | Collection of data that is plotted on the chart. |
 |
Legend | Name of the series added in the chart along with predefined symbols and colors used to plot data for that series. |
 |
Tooltip | Tooltips or labels that appear when you hover on a series. |