
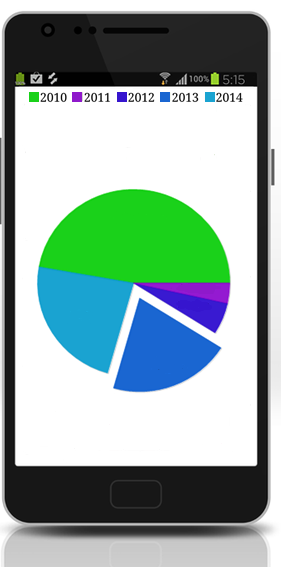
FlexPie
The FlexPie control allows you to create customized pie charts that represent a series as slices of a pie. The arc length of each slice depicts the value represented by that slice. Pie charts are commonly used to display proportional data such as percentage cover. Multi-colored slices make pie charts easy to understand and usually the value represented by each slice is displayed with the help of labels.
Key Features
- Touch Based Labels: Display values using touch based labels.
- Exploding and Donut Pie Charts: Use simple FlexPie properties to convert it into an exploding pie chart or a donut pie chart.