
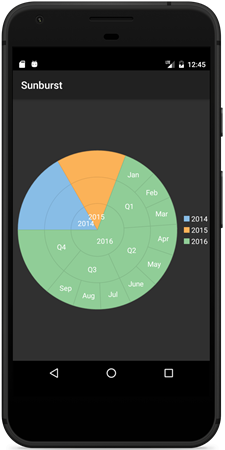
Sunburst Chart
Sunburst chart is used to display hierarchical data, represented using concentric circles. The circle in the center represents the root node, with the data moving outside from the center. A section of the inner circle supports a hierarchical relationship to those sections of the outer circle which lie within the angular area of the parent section. Sunburst chart can be effectively used in scenarios where you want to display hierarchical data, represented using relationship between outer rings and inner rings.
Key Features and Properties
- Donut Chart Support - Specify the control's inner radius property to support donut charts.
- Legend: Provides a short description of data being rendered on chart and you can also change position of the legend as needed.
- Selection: Change the selection mode and customize the selected pie slice appearance.
- Header and Footer: Specifies the title header and footer text.
For more information on Sunburst Chart, see QuickStart.