
Integration with MS DataGridView
This walkthrough explains the steps to show sparklines in the MS DataGridView control. The sparkline control cannot be directly added to the DataGridView cells, but alternatively you can render it as a DataTemplate item in the DataGridView cells. To achieve the same, you can use TemplateColumn as ItemFormatter, as shown in the following example.
To add the Sparkline control in MS DataGridView, follow the given steps:
Add an MS DataGridView control
- Create a new Windows Forms App and set the project framework using Configure your new project window.
- Drag and drop DataGridView control from the Toolbox onto your form, and set its Dock property to Fill from the Properties Window.
This adds the MS DataGridView control to your application.
Step 2: Create a Data Source
Create a class named RegionSalesData to be used as a data source for the DataGridView.
public ObservableCollection<double> Data { get; set; }
public string State { get; set; }
public double TotalSales { get; set; }
public string TotalSalesFormatted
{
    get
    {
        return String.Format("{0:c2}", this.TotalSales);
    }
}
public double NetSales { get; set; }
}
Add the following code to MainWindow.xaml.cs to set the DataContext for binding the control using an ObservableCollection of RegionSalesData type.
public partial class MainWindow : Window
{
    public ObservableCollection<RegionSalesData> Sales { get; set; }
    public MainWindow()
    {
        InitializeComponent();
        Random rnd = new Random();
        string[] states = new string[] { "Alabama", "Alaska", "Arizona", "Idaho", "Illinois", "Indiana", "Ohio", "Oklahoma", "Oregon", "Pennsylvania", "Vermont", "Virginia", "Washington" };
        this.Sales = new ObservableCollection<RegionSalesData>();
        for (int i = 0; i < states.Length; i++)
        {
            RegionSalesData rsd = new RegionSalesData();
            rsd.State = states[i];
            rsd.Data = new ObservableCollection<double>();
            for (int j = 0; j < 12; j++)
            {
                double d = rnd.Next(-50, 50);
                rsd.Data.Add(d);
                rsd.NetSales += d;
                rsd.TotalSales += Math.Abs(d);
            }
            this.Sales.Add(rsd);
        }
        this.DataContext = this;
    }
}
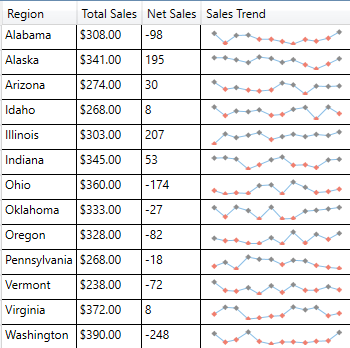
Step 3: Show Sparklines
Add the following code to MainWindow.xaml form to bind the data to the MS DataGridView, and to render Sparklines using the TemplateColumn property.
<DataGrid x:Name="grid" AutoGenerateColumns="False" ItemsSource="{Binding Sales}" RowHeight="25" IsReadOnly="True">
    <DataGrid.Columns>
        <DataGridTextColumn Header="Region" Binding="{Binding State}" />
        <DataGridTextColumn Header="Total Sales" Binding="{Binding TotalSalesFormatted}" />
        <DataGridTextColumn Header="Net Sales" Binding="{Binding NetSales}" />
        <DataGridTemplateColumn Header="Sales Trend" Width="150">
            <DataGridTemplateColumn.CellTemplate>
                <DataTemplate>
                    <c1:C1Sparkline Data="{Binding Data}" SparklineType="Line" ShowMarkers="True" MarkersColor="#FF8C8C8C" SeriesColor="#FF88BDE6" NegativeColor="#FFF07E6E" ShowNegative="True" />
                </DataTemplate>
            </DataGridTemplateColumn.CellTemplate>
        </DataGridTemplateColumn>
    </DataGrid.Columns>
</DataGrid>