
Statistical Charts
FlexChart allows you to create three types of statistical charts as shown in the following table:
| Chart Type | Chart Snapshot | Description |
|---|---|---|
| Box-and-Whisker | 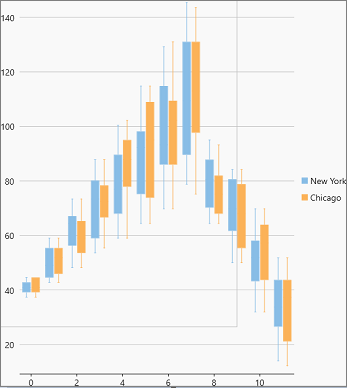 |
Box-and-whisker chart is used to display the distribution of numerical data in the form of quartiles, means and outliers. |
| ErrorBar | 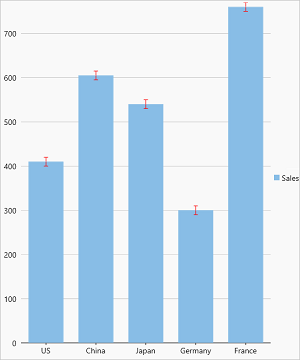 |
Error bar chart is used to indicate the estimated error in the measured data through standard deviation of the data set. |
| Histogram | 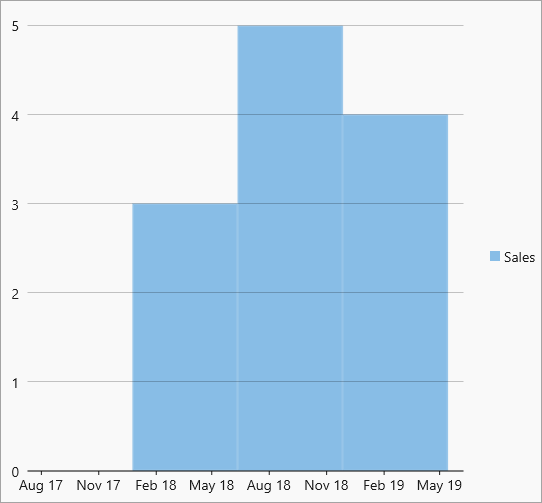 |
Histogram chart is used to present the data distribution over a continuous interval to know which sub-interval gets the maximum or minimum frequency. |