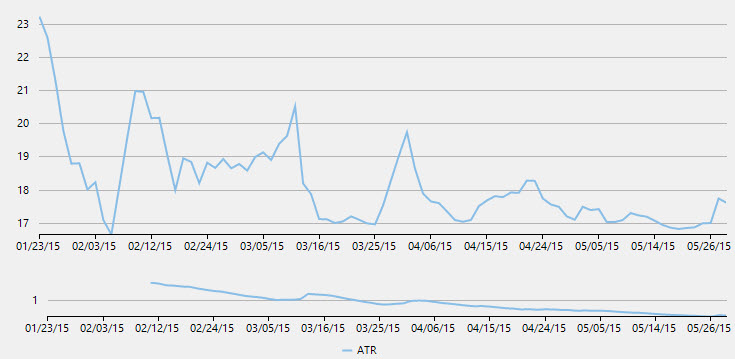
Average True Range
Average True Range (ATR) is a technical indicator for measuring the volatility of an asset. It does not provide an indication of the price trend, but of the degree of the price volatility. It is typically based on 14 periods, and could be calculated intra daily, daily, weekly or monthly basis. Stocks having high volatility will have a higher ATR, while low volatility stocks will have a lower ATR.
FinancialChart also enables you to fetch the calculated ATR values at run-time using GetValues() method. This can help in creating alerts in application or maintaining logs while working with dynamic data.
The following code snippet creates an instance of the ATR class to use Average True Indicator. Also, the sample uses a class DataService.cs to get data for the financial chart.
Public Class DataService
    Public Class DataService
        Private _companies As New List(Of Company)()
        Public Sub New()
            _companies.Add(New Company() With {
            .Symbol = "box",
            .Name = "Box Inc"
        })
            _companies.Add(New Company() With {
            .Symbol = "fb",
            .Name = "Facebook"
        })
        End Sub
        Public Function GetCompanies() As List(Of Company)
            Return _companies
        End Function
        Public Function GetSymbolData(symbol As String) As List(Of Quote)
            Dim path As String = String.Format("FinancialChartExplorer.Resources.{0}.json", symbol)
            Dim stream = Assembly.GetExecutingAssembly().GetManifestResourceStream(path)
            Dim ser = New System.Runtime.Serialization.Json.DataContractJsonSerializer(GetType(Quote()))
            Dim data = DirectCast(ser.ReadObject(stream), Quote())
            Return data.ToList()
        End Function
        Shared _ds As DataService
        Public Shared Function GetService() As DataService
            If _ds Is Nothing Then
                _ds = New DataService()
            End If
            Return _ds
        End Function
    End Class
    Public Class Quote
        Public Property [date](/componentone/docs/win/online-financialchart/Analytics/Indicators/AverageTrueRange) As String
            Get
                Return m_date
            End Get
            Set
                m_date = Value
            End Set
        End Property
        Private m_date As String
        Public Property high() As Double
            Get
                Return m_high
            End Get
            Set
                m_high = Value
            End Set
        End Property
        Private m_high As Double
        Public Property low() As Double
            Get
                Return m_low
            End Get
            Set
                m_low = Value
            End Set
        End Property
        Private m_low As Double
        Public Property open() As Double
            Get
                Return m_open
            End Get
            Set
                m_open = Value
            End Set
        End Property
        Private m_open As Double
        Public Property close() As Double
            Get
                Return m_close
            End Get
            Set
                m_close = Value
            End Set
        End Property
        Private m_close As Double
        Public Property volume() As Double
            Get
                Return m_volume
            End Get
            Set
                m_volume = Value
            End Set
        End Property
        Private m_volume As Double
    End Class
    Public Class Company
        Public Property Symbol() As String
            Get
                Return m_Symbol
            End Get
            Set
                m_Symbol = Value
            End Set
        End Property
        Private m_Symbol As String
        Public Property Name() As String
            Get
                Return m_Name
            End Get
            Set
                m_Name = Value
            End Set
        End Property
        Private m_Name As String
    End Class
End Class
public class DataService
{
List<Company> _companies = new List<Company>();
public DataService()
{
_companies.Add(new Company() { Symbol = "box", Name = "Box Inc" });
_companies.Add(new Company() { Symbol = "fb", Name = "Facebook" });
}
public List<Company> GetCompanies()
{
return _companies;
}
public List<Quote> GetSymbolData(string symbol)
{
string path = string.Format("FinancialChartExplorer.Resources.{0}.json", symbol);
var stream = Assembly.GetExecutingAssembly().GetManifestResourceStream(path);
var ser = new System.Runtime.Serialization.Json.DataContractJsonSerializer(typeof(Quote[]));
var data = (Quote[])ser.ReadObject(stream);
return data.ToList();
}
static DataService _ds;
public static DataService GetService()
{
if (_ds == null)
_ds = new DataService();
return _ds;
}
}
public class Quote
{
public string date { get; set; }
public double high { get; set; }
public double low { get; set; }
public double open { get; set; }
public double close { get; set; }
public double volume { get; set; }
}
public class Company
{
public string Symbol { get; set; }
public string Name { get; set; }
}Dim atr As New ATR() With
{
.Name = "ATR"
}
Dim dataService__1 = DataService.GetService()
Dim data = dataService__1.GetSymbolData("box")
FinancialChart1.BeginUpdate()
FinancialChart1.BindingX = "date"
FinancialChart1.Binding = "close"
FinancialChart1.Series.Add(New FinancialSeries())
FinancialChart1.ChartType = C1.Chart.Finance.FinancialChartType.Line
FinancialChart1.DataSource = data
FinancialChart1.Rendered += Function(s, a)
financialChart2.AxisX.Min = FinancialChart1.AxisX.ActualMin
financialChart2.AxisX.Max = FinancialChart1.AxisX.ActualMax
End Function
FinancialChart1.EndUpdate()
financialChart2.BeginUpdate()
financialChart2.ChartType = C1.Chart.Finance.FinancialChartType.Line
financialChart2.BindingX = "date"
financialChart2.Binding = "high,low,close"
financialChart2.Series.Add(atr)
financialChart2.Legend.Position = C1.Chart.Position.Bottom
financialChart2.DataSource = data
financialChart2.EndUpdate()
period.Value = atr.PeriodATR atr = new ATR() { Name = "ATR" };
var dataService = DataService.GetService();
var data = dataService.GetSymbolData("box");
financialChart1.BeginUpdate();
financialChart1.BindingX = "date";
financialChart1.Binding = "close";
financialChart1.Series.Add(new FinancialSeries());
financialChart1.ChartType = C1.Chart.Finance.FinancialChartType.Line;
financialChart1.DataSource = data;
financialChart1.Rendered += (s, a) =>
{
financialChart2.AxisX.Min = financialChart1.AxisX.ActualMin;
financialChart2.AxisX.Max = financialChart1.AxisX.ActualMax;
};
financialChart1.EndUpdate();
financialChart2.BeginUpdate();
financialChart2.ChartType = C1.Chart.Finance.FinancialChartType.Line;
financialChart2.BindingX = "date";
financialChart2.Binding = "high,low,close";
financialChart2.Series.Add(atr);
financialChart2.Legend.Position = C1.Chart.Position.Bottom;
financialChart2.DataSource = data;
financialChart2.EndUpdate();
period.Value = atr.Period;