
Integration with FlexChart
The Expression Editor supports integration with the FlexChart control. Expression Editor, when integrated with chart, enables manipulating the visualization of chart using expressions.
To integrate Expression Editor with FlexChart, you need to use DataSource property of C1FlexChart class that gets a collection of objects containing the series data. After getting the series data, data source of FlexChart can be bound to data source of Expression Editor using its DataSource property.
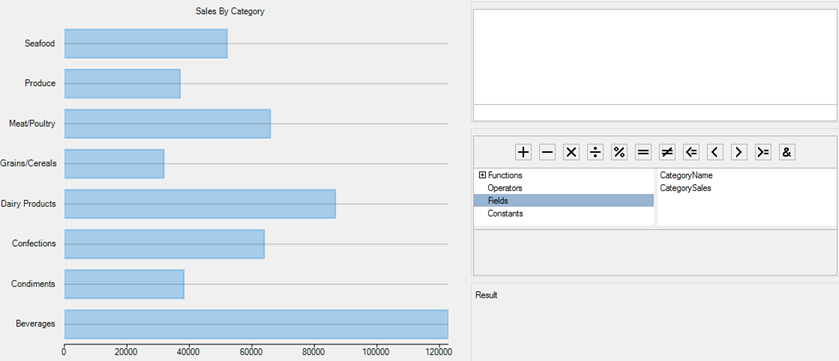
The following image exhibits Expression Editor integrated with the FlexChart control.
The following code demonstrates integrating FlexChart with Expression Editor control.
FlexChart _flexChart;
C1ExpressionEditor _expEditor;
C1ExpressionEditorPanel _expPanel;
DataView _dvProducts;
DataSet _ds;
public Form1()
{
    InitializeComponent();
    GetDataSource();
    _flexChart = new FlexChart();
    _flexChart.Dock = DockStyle.Fill;
    _flexChart.ChartType = C1.Chart.ChartType.Bar;
    _flexChart.Header.Content= "Sales By Category";
    _expEditor = new C1ExpressionEditor();
    _expEditor.Dock = DockStyle.Fill;
    _expEditor.ExpressionChanged += _expEditor_ExpressionChanged;
    _expPanel = new C1ExpressionEditorPanel();
    _expPanel.Dock = DockStyle.Fill;
    _expPanel.BringToFront();
    _expPanel.ExpressionEditor = _expEditor;
    pnlFlexChart.Controls.Add(_flexChart);
    grpEditor.Controls.Add(_expEditor);
    grpExpPanel.Controls.Add(_expPanel);
    _dvProducts = _ds.Tables["Sales"].DefaultView;
    _flexChart.DataSource = _dvProducts;
    _flexChart.BindingX = "CategoryName";
    _flexChart.Binding = "CategorySales";
    Series Sales = new Series();
    Sales.Name = "Sales";
    _flexChart.Series.Add(new Series());
    _expEditor.DataSource = _ds.Tables[0];
For the detailed data refer the sample project ExpressionEditorSamples accompanying the installer.