
- 3D Chart for WinForms Overview
- Key Features
- 3D Chart Design-Time Support
- 3D Chart Fundamentals
- 3D Axes
- Design-Time Tools for Creating 3D Charts
- 3D Data
- 3D Labels
- 3D Chart Elements
- 3D Contour Styles
- 3D Chart End-User Interaction
- Chart 3D for WinForms Samples
- Chart 3D for WinForms Task-Based Help
- Chart 3D for WinForms Frequently Asked Questions
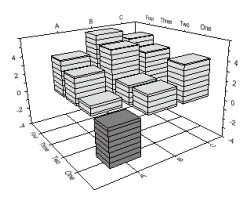
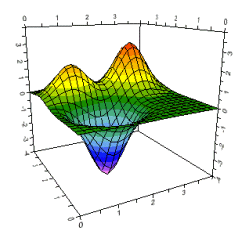
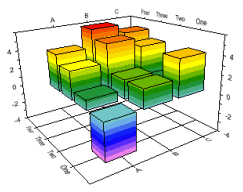
Contour and Zoned Charts
You can easily add contours and zones to 3D charts by enabling the IsContoured and IsZoned properties. These properties are located in the Chart3DGroup Collection Editor (IsContoured and IsZoned are under the Contour node) that can be accessed through the ChartGroups property in the .NET Properties window. For more information on the Chart3DGroup Collection Editor, see Chart3DGroup Collection Editor.
Using IsContoured Property
The Surface and Bar 3D charts behave as the following when they are contoured:
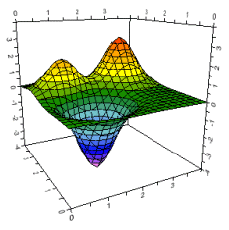
Surfaces: The chart examines the distribution of the data and draws contour lines demarcating each of the contour levels.
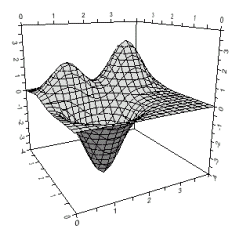
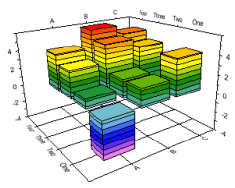
Bars: The chart draws contour lines around the bars, demarcating each contour level.
Note: The chart's contour levels, ContourStyles, and other contour properties can be customized.
Using IsZoned Property
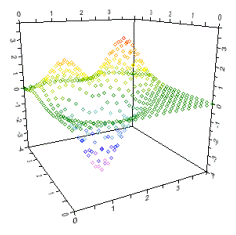
The Surface, Bar, and Scatter 3D charts behave as the following when they are zoned:
Surfaces: The chart examines the distribution of the data and fills each level with a solid color.
Bars: The chart fills each level within each bar with a solid color.
Scatter: The points are colored according to their z-value.
Note: The chart's contour levels, ContourStyles, and other zoning properties can be customized
Using IsContoured and IsZoned Properties
You can combine contours and zones to Surfaces, Bars, and Scatter 3D charts by enabling both IsContoured and IsZoned properties.
The following table illustrates a combination of contours and zones in Surface and Bar 3D charts:
Surface Example | Bar Example |
|---|---|
|
|
Note: The chart's contour levels, ContourStyles, and other contour and zoning properties can be customized.