
- 2D Chart for WinForms Overview
- Key Features
- Chart for WinForms Quick Start
- Design-Time Support
- Chart Fundamentals
- Common Usage for Basic 2D Charts
- Specific 2D Charts
- Design-Time Tools for Creating 2D Charts
- Charting Data
- Data Binding
- Charting Labels
- Chart Area and Plot Area Objects
- Customizing Chart Elements
- Loading and Saving Charts, Data, and Images
- End-User Interaction
- Chart for WinForms Samples
- Chart for WinForms Tutorials
- Chart for WinForms Task-Based Help
PlotArea Object
The following illustration shows the PlotArea object on C1Chart:
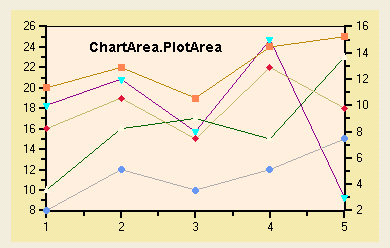
The PlotArea object represents the part of the chart area that is used to display the data series. The most common properties used to customize the PlotArea include the following:
| Property | Description |
|---|---|
| BackColor | Sets the color of the background of the PlotArea. |
| Boxed | Determines whether the PlotArea has a solid border around it. |
| ForeColor | Sets the color of the border around the PlotArea (when Boxed is set to True). |
| View3D | Returns a View3D object that allows you to add 3D effects to 2D charts. |
For more information on customizing the plot area, see Plot Area.