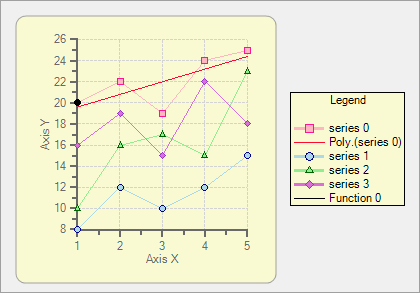
The following graphic illustrates the Legend element in C1Chart:

The legend element displays information about each data series of the chart. The chart legend displays the mapping between the physical colors and the data series. The legend is controlled by the Legend property, which returns a Legend object with the following main properties:
| Property | Description |
|---|---|
| Text | Contains text displayed in the legend title. |
| Style | Contains properties that set the font, orientation, colors, and border of the legend. |
| Compass | Determines the position of the legend. |
| Visible | Determines whether the legend is visible. |
| Orientation | Determines whether the legend items should be displayed in the horizontal or vertical direction. |
| Reversed | Controls the order that the ChartGroups appear in the legend. The order in which items of a ChartGroup appear in the legend is controlled by the LegendReversed property of each ChartGroup. |
C1Chart sizes and positions the legend automatically, based on its contents and the Compass and Orientation properties. To customize the legend position, the SizeDefault and LocationDefault properties can be modified (negative values activate the automatic sizing and positioning).
Note that the Legend property does not control the text for each legend item. It is determined by the label attached to each series. For example, Label contains the text and LegendEntry determines whether the series label should be displayed in the legend.
The legend element can be created programmatically through its Legend object or they can be created at design time through the Chart's Properties window, Chart Properties designer, or by Chart's Smart Designer.
The simplest way of creating them is through the Chart's Smart Designer. For more information on creating a chart legend through the Chart's Smart Designer, see Add a Chart Legend. For more information on positioning the chart legend programmatically see Displaying both the Chart Legend and Chart Header.