- 2D Chart for WinForms Overview
- Key Features
- Chart for WinForms Quick Start
- Design-Time Support
- Chart Fundamentals
- Common Usage for Basic 2D Charts
- Specific 2D Charts
- Design-Time Tools for Creating 2D Charts
- Charting Data
- Data Binding
- Charting Labels
- Chart Area and Plot Area Objects
- Customizing Chart Elements
- Loading and Saving Charts, Data, and Images
- End-User Interaction
- Chart for WinForms Samples
- Chart for WinForms Tutorials
- Chart for WinForms Task-Based Help
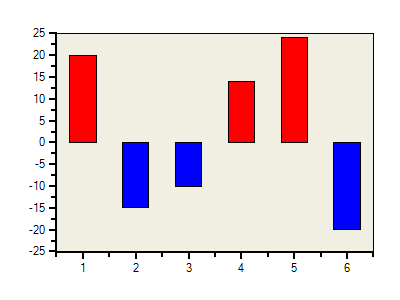
Creating Custom PointStyles
To define custom point style condition the user must set Selection property of PointStyle to PointStyleSelectionEnum.Custom and provide event handler for the Select event. The following code creates a custom point style:
To write code in Visual Basic
Private Sub Button1_Click(ByVal sender As System.Object, ByVal e As System.EventArgs)_ Handles Button1.Click
         ' create point style
        Dim ps As C1.Win.C1Chart.PointStyle = New C1.Win.C1Chart.PointStyle()
         ' custom point style
        ps.Selection = C1.Win.C1Chart.PointStyleSelectionEnum.Custom
        AddHandler ps.Select, AddressOf PS_Select
          ' add point style
        c1Chart1.ChartGroups(0).ChartData.PointStylesList.Add(ps)
End Sub
Private Sub PS_Select(ByVal sender As Object, ByVal e As _   C1.Win.C1Chart.PointStyleSelectEventArgs)
        Dim ps As C1.Win.C1Chart.PointStyle = CType(sender, C1.Win.C1Chart.PointStyle)
          ' set visual appearance depending on y value
        Dim ds As C1.Win.C1Chart.ChartDataSeries = _   c1Chart1.ChartGroups(0).ChartData(e.SeriesIndex)
        Dim y As Double = Convert.ToDouble(ds.Y(e.PointIndex))
        If (y < 0) Then
                ps.LineStyle.Color = Color.Blue
        Else
                ps.LineStyle.Color = Color.Red
        End If
          ' apply to all points
        e.Selected = True
End Sub
To write code in C#
private void button1_Click(object sender, System.EventArgs e)
{
   // create point style
  C1.Win.C1Chart.PointStyle ps = new C1.Win.C1Chart.PointStyle();
   // custom point style
  ps.Selection = C1.Win.C1Chart.PointStyleSelectionEnum.Custom;
  ps.Select += new C1.Win.C1Chart.PointStyleSelectEventHandler(PS_Select);
   // add point style
  c1Chart1.ChartGroups[0].ChartData.PointStylesList.Add( ps);
}
private void PS_Select( object sender, C1.Win.C1Chart.PointStyleSelectEventArgs e)
{
        C1.Win.C1Chart.PointStyle ps = sender as C1.Win.C1Chart.PointStyle;
         // set visual appearance depending on y value
        C1.Win.C1Chart.ChartDataSeries ds = c1Chart1.ChartGroups[0].ChartData[e.SeriesIndex];
        double y = Convert.ToDouble( ds.Y[e.PointIndex]);
        if( y<0)
                ps.LineStyle.Color = Color.Blue;
        else
                ps.LineStyle.Color = Color.Red;
         // apply to all points
        e.Selected = true;
}
A custom blue point style is created for Y values less than zero and a custom red point style is created for y values greater than zero.