- 2D Chart for WinForms Overview
- Key Features
- Chart for WinForms Quick Start
- Design-Time Support
- Chart Fundamentals
- Common Usage for Basic 2D Charts
- Specific 2D Charts
- Design-Time Tools for Creating 2D Charts
- Charting Data
- Data Binding
- Charting Labels
- Chart Area and Plot Area Objects
- Customizing Chart Elements
- Loading and Saving Charts, Data, and Images
- End-User Interaction
- Chart for WinForms Samples
- Chart for WinForms Tutorials
- Chart for WinForms Task-Based Help
Chart Borders
Adding a border to part of the chart can help highlight important information, or simply make the chart look more attractive. The border style, color, rounding, and width can be set using the respective properties: BorderStyle, Color, Rounding, and Thickness. Using these properties you can create customized borders for any of the following chart elements:
- Header and Footer titles
- Legend
- ChartArea
- The entire chart
The following table defines and illustrates the effect of each value in the BorderStyleEnum:
| Member name | Description | Effect |
|---|---|---|
| NotSet | Border style is not set and is inherited from C1Chart class. | |
| None | No border. | |
| Empty | Empty border. | |
| Solid | Solid line border. |  |
| Raised | Raised 3D border, drawn using system colors. |  |
| Inset | Inset 3D border with bevel. |  |
| RaisedBevel | Raised 3D border with bevel. |  |
| InsetBevel | Inset 3D border with bevel. |  |
| Groove | Compound border (inset+raised). |  |
| Fillet | Compound border (raised+inset). |  |
| Double | Double solid line border. |  |
| Dashed | Dashed line border. |  |
| Opaque | The opaque border style ensures that anti-aliasing is turned off when drawing the border. Opaque borders ignore Rounding settings. This border style can be useful for generating chart images to be use with transparent backgrounds. |
The border properties can be modified at design time using the Chart Properties designer, Properties window, or Chart Smart Designer. These properties are located under the Style nodes in the Visual Studio Properties window, which can be found on the Control, ChartArea, Titles, Legend, and ChartLabels objects.
To change the border style of the ChartArea at design time
To change the border style of the ChartArea element at design time using the Visual Studio Properties window, complete the following:
- Expand the ChartArea node in the c1Chart1 properties window.
- Expand the Style->Border property.
- Click on the dropdown arrow next to the BorderStyle property and select a border style, for example Dashed.
To change the border style of the ChartArea programatically
To write code in Visual Basic
C1Chart1.ChartArea.Style.Border.BorderStyle = BorderStyleEnum.Dashed
To write code in C#
C1Chart1.ChartArea.Style.Border.BorderStyle = BorderStyleEnum.Dashed;
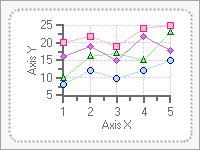
The dashed border appears around the ChartArea element like the following:


