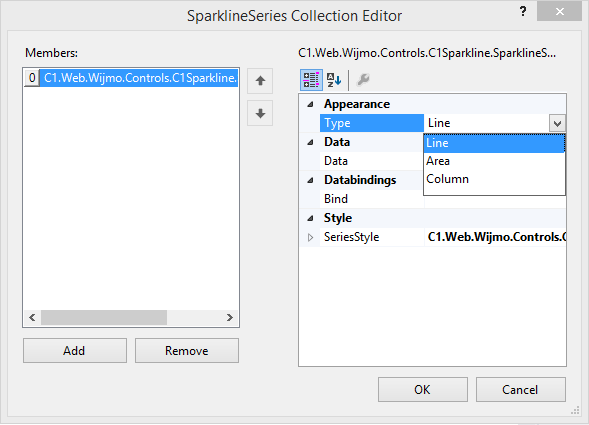
You can represent the data using three types of sparklines: Line, Area and Column. By default the chart type is set to Line.
Modify the <cc1:C1SiteMap></cc1:C1SiteMap>tags, to customize and add data to the control:
<cc1:C1Sparkline ID="C1Sparkline1" runat="server">
        <SeriesList>
        <cc1:SparklineSeries Data="33,11,15,26,16,27,37,-13,8,-8,-3,17,0,22,-13,-29,19,8"
    Type="Area" >
        </cc1:SparklineSeries>
        </SeriesList>
        </cc1:C1Sparkline>
Add the following code to the Page_Load event, to customize and add data to the Sparkline control.
To write code in C#
   C1Sparkline1.Height = 150;
   C1Sparkline1.Width = 200;
        double[] data = { 33, 11, 15, 26, 16, 27, 37, -13, 8, -8, -3, 17,
           0, 22, -13,-29, 19, 80 };
   C1Sparkline1.SeriesList[0].Data = data;
To write code in VB
   C1Sparkline1.Height = 150
   C1Sparkline1.Width = 200
     Dim data As Double() = {33, 11, 15, 26, 16, 27,37, -13, 8, -8, -3, 17,
           0, 22, -13, -29, 19, 80}
   C1Sparkline1.SeriesList(0).Data = data
When you select Area, Column or Line type and run the project, sparkline would appear as shown in the images below:
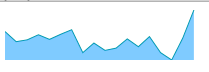
Area Sparkline

Column Sparkline

Line Sparkline