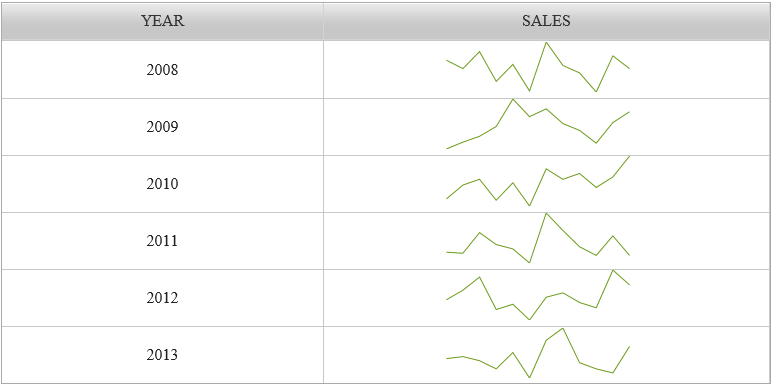
Complete the following steps to add a Sparkline to the GridView control.
The following steps are for an application created on Visual Studio 2012. The steps may be differ slightly based on the version of Visual Studio you use.
1. In the Toolbox, locate C1GridView control and drag it onto the Web Form.
Add the following markup within the <cc1: C1GridView></cc1:C1GridView> tags to add sparkline in the GridView. This adds a BoundField and ItemTemplate to the GridView.
<cc1:C1GridView ID="C1GridView1" runat="server" AutogenerateColumns="False" AllowColSizing="True">
        <Columns>
            <cc1:C1BoundField DataField="Year" HeaderText="YEAR" SortExpression="Year">
                <ItemStyle HorizontalAlign="Center" />
            </cc1:C1BoundField>
            <cc1:C1TemplateField HeaderText="SALES">
                <ItemStyle HorizontalAlign="Center" />
                <ItemTemplate>
                    <cc1:C1Sparkline ID="C1Sparkline1" runat="server">
                        <SeriesList>
                            <cc1:SparklineSeries>
                            </cc1:SparklineSeries>
                        </SeriesList>
                    </cc1:C1Sparkline>
                </ItemTemplate>
            </cc1:C1TemplateField>
      </Columns>
Add the code below to the Page_Load event, to add data to the GridView control. The code below shows sales data for different years.
To write code in C#
 var data = new[]
 {
  new { Year = "2008", Sales = new List<double>{95, 87, 103, 75, 91, 66, 112,

90, 83, 65, 99, 87}},
  new { Year = "2009", Sales = new List<double>{69, 76, 82, 92, 120, 102, 110,

95, 88, 75, 96, 107}},
  new { Year = "2010", Sales = new List<double>{75, 87, 92, 74, 89, 69, 101,

92, 97, 85, 94, 112}},
  new { Year = "2011", Sales = new List<double>{88, 87, 106, 95, 91, 78, 124, 1

08, 93, 85, 103, 85}},
  new { Year = "2012", Sales = new List<double>{86, 97, 112, 75, 81, 63, 89,

94, 83, 77, 120, 103}},
  new { Year = "2013", Sales = new List<double>{105, 107, 103, 95, 111, 86,

123, 135, 101, 95, 91, 117}},
 };
     C1GridView1.RowDataBound += C1GridView1_RowDataBound;
     C1GridView1.DataSource = data;
     C1GridView1.DataBind();
 }
 void C1GridView1_RowDataBound(object sender,

  C1.Web.Wijmo.Controls.C1GridView.C1GridViewRowEventArgs e)
 {
     var C1sparkline1 = e.Row.FindControl("C1Sparkline1") as C1Sparkline;
     var prop1 = e.Row.DataItem.GetType().GetProperty("Sales");
     C1sparkline1.DataSource = prop1.GetValue(e.Row.DataItem, null);
     C1sparkline1.DataBind();
To write code in VB
Dim data As Object() = {
       New With {Key .Year = "2008", Key .Sales = New List(Of Double)()
 From {95, 87, 103, 75, 91, 66, 112, 90, 83, 65, 99, 87}},
       New With {Key .Year = "2009", Key .Sales = New List(Of Double)()
 From {69, 76, 82, 92, 120, 102, 110, 95, 88, 75, 96, 107}},
       New With {Key .Year = "2010", Key .Sales = New List(Of Double)()
 From {75, 87, 92, 74, 89, 69, 101, 92, 97, 85, 94, 112}},
       New With {Key .Year = "2011", Key .Sales = New List(Of Double)()
 From {88, 87, 106, 95, 91, 78, 124, 108, 93, 85, 103, 85}},
       New With {Key .Year = "2012", Key .Sales = New List(Of Double)()
 From {86, 97, 112, 75, 81, 63, 89, 94, 83, 77, 120, 103}},
       New With {Key .Year = "2013", Key .Sales = New List(Of Double)()
 From {105, 107, 103, 95, 111, 86, 123, 135, 101, 95, 91, 117}}
        }
AddHandler C1GridView1.RowDataBound, AddressOf C1GridView1_RowDataBound
C1GridView1.DataSource = data

 C1GridView1.DataBind()
 End Sub

Private Sub C1GridView1_RowDataBound(sender As Object,
 e As C1.Web.Wijmo.Controls.C1GridView.C1GridViewRowEventArgs)
   Dim C1sparkline1 = TryCast(e.Row.FindControl("C1Sparkline1"), C1Sparkline)
   Dim prop1 = e.Row.DataItem.[GetType]().GetProperty("Sales")
   C1sparkline1.DataSource = prop1.GetValue(e.Row.DataItem, Nothing)
   C1sparkline1.DataBind()
 End Sub
When you run the project, Sparkline charts appear as shown in the image below.
