This topic shows how to bind the CompositeChart control to render shared pie series. Add the composite chart control on to the form and complete the following steps:
select top 5 CategoryName, sum(ProductSales) as Sales from (SELECT DISTINCTROW
Categories.CategoryName as CategoryName, Products.ProductName,
Sum([Order Details Extended].ExtendedPrice) AS ProductSales FROM Categories
INNER JOIN (Products INNER JOIN (Orders INNER JOIN [Order Details Extended]
ON Orders.OrderID = [Order Details Extended].OrderID) ON Products.ProductID
= [Order Details Extended].ProductID) ON Categories.CategoryID = Products.CategoryID
WHERE (((Orders.OrderDate) Between #1/1/95# And #12/31/95#)) GROUP BY
Categories.CategoryID, Categories.CategoryName, Products.ProductName ORDER BY
Products.ProductName) group by CategoryName
Add the following code to the form to initialize and configure the SqlDataSource.
| SQLDataSource |
Copy Code
|
|---|---|
<asp:SqlDataSource ID="SqlDataSource1" runat="server" ConnectionString="<%$ConnectionStrings:ConnectionString %>" ProviderName=" <%$ ConnectionStrings:ConnectionString.ProviderName %>" SelectCommand="select top 5 CategoryName, sum(ProductSales) as Sales from (SELECT DISTINCTROW Categories.CategoryName as CategoryName, Products.ProductName, Sum([Order Details Extended].ExtendedPrice) AS ProductSales FROM Categories INNER JOIN (Products INNER JOIN (Orders INNER JOIN [Order Details Extended] ON Orders.OrderID = [Order Details Extended].OrderID) ON Products.ProductID = [Order Details Extended].ProductID) ON Categories.CategoryID = Products.CategoryID WHERE (((Orders.OrderDate) Between #1/1/95# And #12/31/95#)) GROUP BY Categories.CategoryID, Categories.CategoryName, Products.ProductName ORDER BY Products.ProductName) group by CategoryName "></asp:SqlDataSource> |
|
Use the following code to the form to initialize and databind the CompositeChart control.
| SQLDataSource |
Copy Code
|
|---|---|
<wijmo:C1CompositeChart runat="server" ID="CompositeChart1" Culture="en-US" DataSourceID="SqlDataSource1" Height="475px" Width="756px"> <DataBindings> <wijmo:C1CompositeChartBinding Type="SharedPie" Center="200, 140" PieSeriesDataField="Sales" Radius="80" PieSeriesLabelField="CategoryName" SharedPieGroup="A" /> <wijmo:C1CompositeChartBinding Type="SharedPie" Center="400, 140" PieSeriesDataField="Sales" Radius="80" PieSeriesLabelField="CategoryName" SharedPieGroup="B" /> <wijmo:C1CompositeChartBinding Type="SharedPie" Center="200, 320" PieSeriesDataField="Sales" Radius="80" PieSeriesLabelField="CategoryName" SharedPieGroup="A" /> <wijmo:C1CompositeChartBinding Type="SharedPie" Center="400, 320" PieSeriesDataField="Sales" Radius="80" PieSeriesLabelField="CategoryName" SharedPieGroup="B" /> </DataBindings> </wijmo:C1CompositeChart> |
|
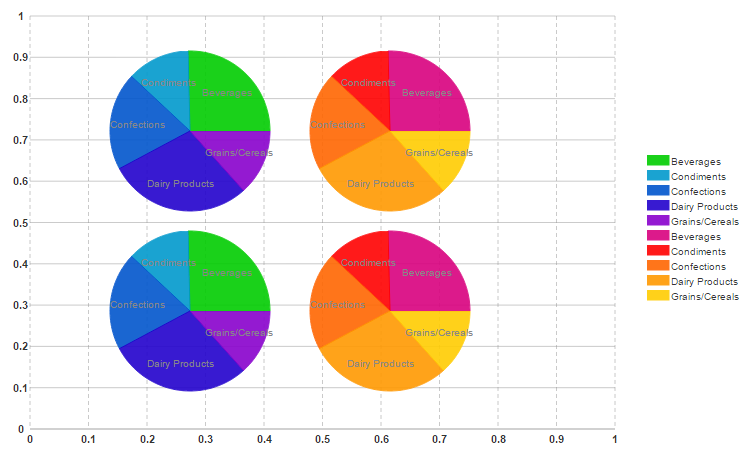
This Topic Illustrates the Following:
The following image shows composite chart rendered as a shared pie chart: