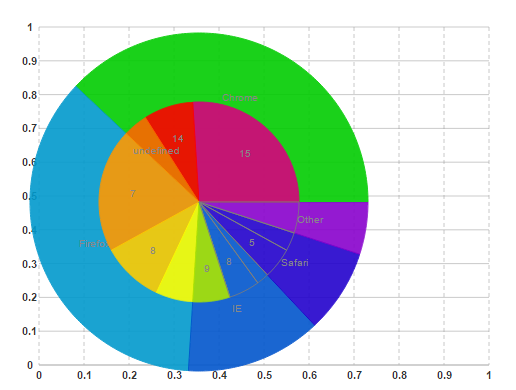
This topic demonstrates how to create a Donut Pie chart in a composite chart. This special type of chart combines two pie charts containing related data. The pie charts share the same center point so they overlap properly and different radius property so the outer and the inner pie charts can be distinguished from one another.
To add a shared pie chart data to the C1CompositeChart, follow these steps:
| Member | Type | Label | Center | Radius |
| 0 | Pie | Browser | 200, 200 | 200 |
| 1 | Pie | Usage | 200, 200 | 100 |
| Member | Label | Data |
| 0 | Chrome | 38 |
| 1 | Firefox | 36 |
| 2 | IE | 13 |
| 3 | Safari | 8 |
| 4 | Others | 5 |
| Member | Label | Data |
| 0 | 15 | 26 |
| 1 | 14 | 8 |
| 2 | - | 4 |
| 3 | 7 | 20 |
| 4 | 8 | 10 |
| 5 | - | 6 |
| 6 | 9 | 6 |
| 7 | 8 | 5 |
| 8 | - | 2 |
| 9 | 5 | 2 |
| 10 | - | 20 |
Use the following code to add a donut pie series to the composite chart.
| Source View |
Copy Code
|
|---|---|
<wijmo:C1CompositeChart ID="C1CompositeChart1" runat="server"> <SeriesList> <wijmo:CompositeChartSeries Center="200, 200" LegendEntry="False" Radius="200" Type="Pie"> <PieSeriesList> <wijmo:PieChartSeries Data="38" HintContent="" Label="Chrome" LegendEntry="False"> </wijmo:PieChartSeries> <wijmo:PieChartSeries Data="36" HintContent="" Label="Firefox" LegendEntry="False"> </wijmo:PieChartSeries> <wijmo:PieChartSeries Data="13" HintContent="" Label="IE" LegendEntry="False"> </wijmo:PieChartSeries> <wijmo:PieChartSeries Data="8" HintContent="" Label="Safari" LegendEntry="False"> </wijmo:PieChartSeries> <wijmo:PieChartSeries Data="5" HintContent="" Label="Other" LegendEntry="False"> </wijmo:PieChartSeries> </PieSeriesList> </wijmo:CompositeChartSeries> <wijmo:CompositeChartSeries Center="200, 200" LegendEntry="False" Radius="100" Type="Pie"> <PieSeriesList> <wijmo:PieChartSeries Data="26" HintContent="" Label="15" LegendEntry="False"> </wijmo:PieChartSeries> <wijmo:PieChartSeries Data="8" HintContent="" Label="14" LegendEntry="False"> </wijmo:PieChartSeries> <wijmo:PieChartSeries Data="4" HintContent="" Label="" LegendEntry="False"> </wijmo:PieChartSeries> <wijmo:PieChartSeries Data="20" HintContent="" Label="7" LegendEntry="False"> </wijmo:PieChartSeries> <wijmo:PieChartSeries Data="10" HintContent="" Label="8" LegendEntry="False"> </wijmo:PieChartSeries> <wijmo:PieChartSeries Data="6" HintContent="" Label=" " LegendEntry="False"> </wijmo:PieChartSeries> <wijmo:PieChartSeries Data="6" HintContent="" Label="9" LegendEntry="False"> </wijmo:PieChartSeries> <wijmo:PieChartSeries Data="5" HintContent="" Label="8" LegendEntry="False"> </wijmo:PieChartSeries> <wijmo:PieChartSeries Data="2" HintContent="" Label=" " LegendEntry="False"> </wijmo:PieChartSeries> <wijmo:PieChartSeries Data="5" HintContent="" Label="5" LegendEntry="False"> </wijmo:PieChartSeries> <wijmo:PieChartSeries Data="3" HintContent="" Label=" " LegendEntry="False"> </wijmo:PieChartSeries> <wijmo:PieChartSeries Data="5" HintContent="" Label=" " LegendEntry="False"> </wijmo:PieChartSeries> </PieSeriesList> </wijmo:CompositeChartSeries> </SeriesList> </wijmo:C1CompositeChart> |
|
This Topic Illustrates the Following:
The following image shows a Donut PieChart added to a composite chart:
