In This Topic
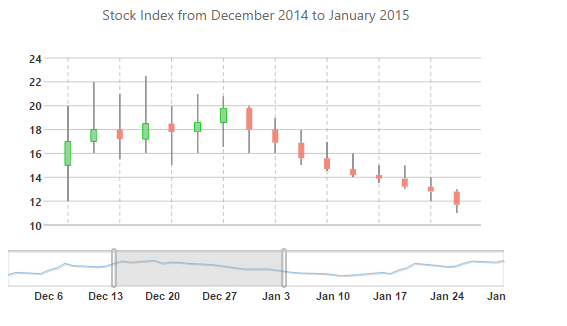
ChartNavigator for ASP.Net Web Forms allows you to visualize data by selecting a small range out of a large data. A user can easily bind ChartNavigator with various types of charts. ChartNavigator provides powerful features such as scrolling and zooming.
C1ChartNavigator supports binding data for the following chart types:
A chart navigator tool is widely used in visualizing financial dashboards data, variation in stock prices. It is the most effective way of selecting ranges instead of single values on a chart.

Key Features:
- TargetSelector: Selects and binds with the target charts in the page. The TargetSelector property accepts a jQuery selector string. For example, to bind a chart with ID 'chart1' to C1ChartNavigator, set TargetSelector value to '#chart1'.
- RangeMin: Sets the start value of the Navigator range. This value must be in between the minimum and maximum values set for the chart data on X-axis.
- RangeMax: Sets the end value of the Navigator range. This value must be in between the minimum and maximum values set for the chart data on X-axis.
- Step: Determines the size of each interval on changing of thumb button. By default, its value is set to 1.
