In This Topic
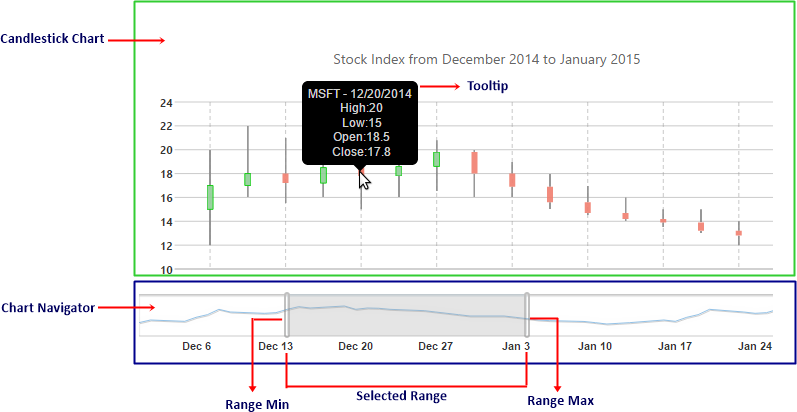
The following illustration shows various elements of C1ChartNavigator.

The navigation layout is divided into two parts, one is C1ChartNavigator and other is the main chart to which the chart navigator is bound.
- Main Chart: The chart displays data of the selected time range on the navigator. A tooltip is displayed when a user hovers on the data displayed on the chart.
- ChartNavigator: The chart navigator pane is displayed just below the main chart. A user can scroll through the desired range of data by dragging the navigator towards left or right of the pane.
The ChartNavigator control includes the following elements:
- Range Min: Left value of the navigator range.
- Range Max: Right value of the navigator range.
- Selected Range: The selected region visualizes the selected range between the minimum and maximum range in a contrasting color.
