A Bar chart draws each series as a bar in a cluster. The sizing and spacing of the clusters for Bar and Stacking Bar charts can be customized.
Cluster Overlap
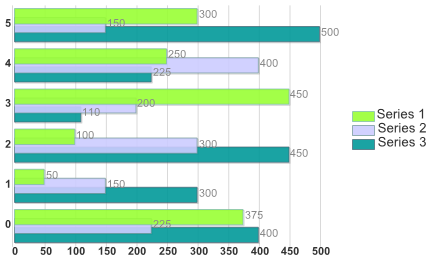
Use the ClusterOverlap property to set the amount that bars overlap each other in a cluster. The value represents the percentage of bar overlap, with valid values between 0 and 100. The following figure illustrates a bar chart with a ClusterOverlap of 50 percent:

Cluster Width
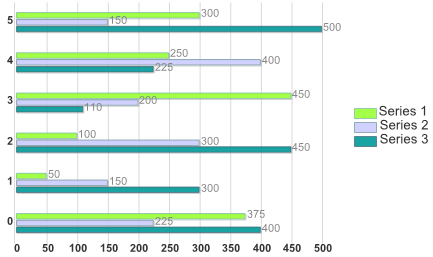
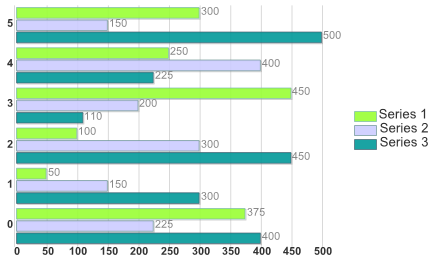
Use the ClusterWidth property to set the space used by each bar cluster. The value represents the percentage of available space, with valid values between 0 and 100.
ClusterWidth = 50%

ClusterWidth = 90%

Cluster Spacing
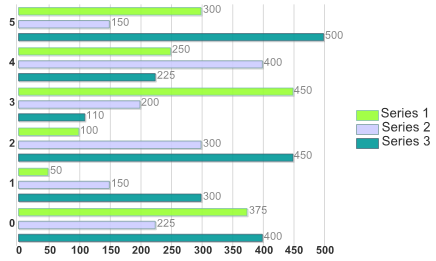
Use the ClusterSpacing property to indicate the spacing between the adjacent bars. The following Bar chart shows the ClusterSpacing property set to 10.
