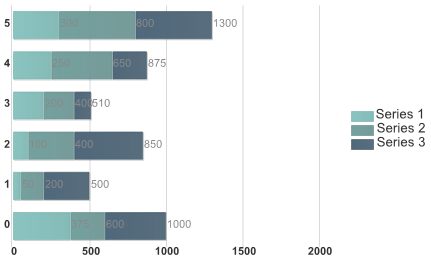
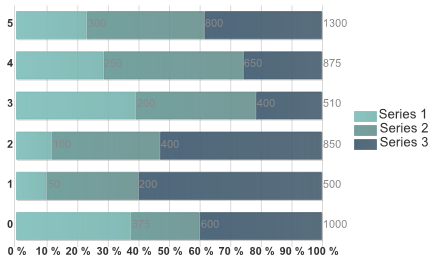
A Stacking Bar chart draws each series as a portion of a stacked bar cluster, the number of clusters being the number of points in the data. Each bar displays the nth data point in each series. A Bar chart or Column chart can be stacked by setting the Stacked property to True.
Stacked Bar Chart
To display a Stacked Bar chart, set the Stacked property to true.

Stacked Percentage Chart
To display a stacked percentage chart, set the Is100Percent to true and Stacked to true.
