Shape Field
Shape Fields are used to display line, isosceles triangle, right triangle, rectangle, ellipse, arc and pie in the report. The shape fields can help highlight sections in FlexReport, and create tables, flow-diagrams, grids etc.
To add a Shape (or Rectangle) field using the FlexReportDesigner application:
Go to the Insert tab and click the Rectangle field icon
 .
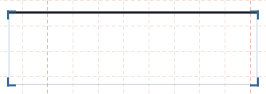
.Click the mouse to mark one corner, and drag the mouse to position the opposite corner.
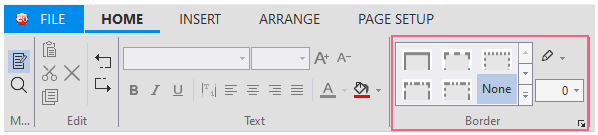
Improve the look of the border of shape by using the Border group on the ribbon under Home tab. Or simply change the Border color, Border style and line width properties from Properties window in the FlexReport Designer.
Preview the report.
Types of Shapes in Report
Learn about the different types of shapes provided by the Shape field in the FlexReport Designer:
Shapes | Snapshot | Description |
|---|---|---|
Line |
| Add lines with any line slant (up or down). |
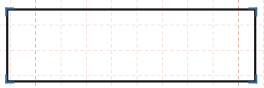
Rectangle |
| Add rectangle shape to the report. |
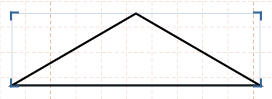
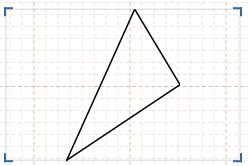
Isosceles Triangle |
| Add Isosceles triangle shape to the report. |
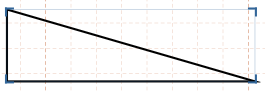
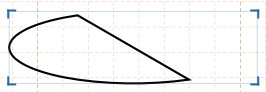
Right Triangle |
| Add right triangle shape to the report. |
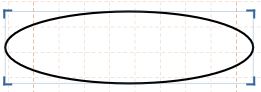
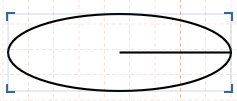
Ellipse |
| Add elliptical shape to the report. |
Pie |
| Add pie shape to the report with different start angle and sweep angle. |
Arc |
| Add arcs to the report, be it closed or open arc, with different start angle and sweep angle. |
Polygon |
| Add polygon to the report with points that specify its vertices. |
None |
| No shape selected. |
Highlight Report Sections
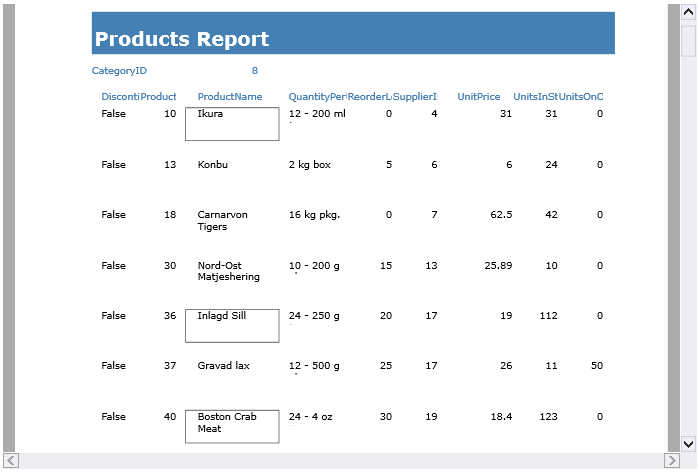
Let's say, you want to highlight the Product Name field in the Product Report obtained from the Quick Start that can be found in the index using shape fields.
FlexReport lets you set rules for defining visibility of the shapes or rectangles in the expressions. For example, to enclose the Product names in rectangular shape when the Reorder Level is less than the Units in Stock, you can enter script code directly into the VBScript Editor of the Detail section's OnPrint property. Complete the following steps:
Select Detail from the Properties window drop-down list in the Designer. This reveals the section's available properties.
Click the ellipsis next to the OnPrint property, to open VBScript Editor.
In the VBScript Editor, simply type the following script:
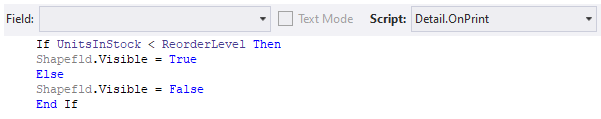
The following screen capture shows a section of the report with the special effects. You can observe the rectangles over the product names that fulfill the condition.
Create Flow Diagrams
FlexReport lets you generate flow diagrams, tables and grids, You can use the ShapeField type and the Border.CornerRadius property on various fields in the report.
For example, the snapshot below shows the preview of the Shapes.flxr flexreport located at Documents\ComponentOne Samples\WinForms\v8.0\FlexReport\CS\FlexReportExplorer\Reports\Controls.

As you can observe different shapes have been used to enclose the items in the flow diagram, such as rectangles (with rounded corners) and lines (slanted up or down).
Let's see how to add a simple line shape to the report using the FlexReport Designer app.