
BulletGraph Features
A BulletGraph displays a single value on a linear scale, along with a target value and ranges that instantly indicate whether the value is Good, Bad or in some other state. It lets you display values across the following three ranges:
- Bad range: Sets a reference value considered bad or unfavorable for the measure. This is set in the BulletGraph using the Bad property of the C1BulletGraph class.
- Good range: Sets a reference value considered good or favorable for the measure. This is set in the BulletGraph using the Good property.
- Target range: Gets or sets the target value for the measure. This is set in the BulletGraph using the Target property.
The following image depicts the BulletGraph control with the specified Bad, Good and Target ranges at 60, 80 and 75 on the linear scale.
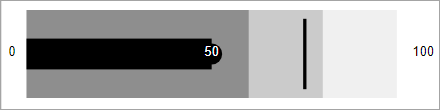
The following code shows how to set the Bad, Good and Target properties in BulletGraph.
<C1BulletGraph Value="50" Bad="60" Good="80" Target="75" TextVisibility="GaugeTextVisibility.All"></C1BulletGraph>
In addition, you can also set the value across the scale to display it on the gauge using the Value property and also display value as text or labels in the gauge using TextVisibility property of the C1Gauge class.