
-
Spread Windows Forms Product Documentation
- Getting Started
-
Developer's Guide
- Understanding the Product
- Working with the Component
- Spreadsheet Objects
- Ribbon Control
- Sheets
- Rows and Columns
- Headers
- Cells
- Cell Types
- Data Binding
- Customizing the Sheet Appearance
- Customizing Interaction in Cells
- Tables
- Pivot Table
- Understanding the Underlying Models
- Customizing Row or Column Interaction
- Formulas in Cells
- Sparklines
- Keyboard Interaction
- Events from User Actions
- File Operations
- Storing Excel Summary and View
- Printing
- Chart Control
- Enhanced Chart
- Customizing Drawing
- Touch Support with the Component
- Spread Designer Guide
- Assembly Reference
- Import and Export Reference
- Version Comparison Reference
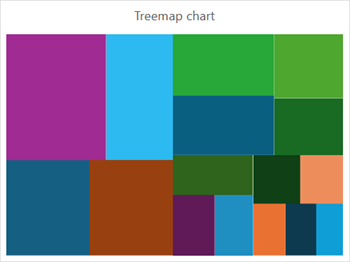
Treemap Chart
Treemap charts are used to display hierarchical data as a set of nested rectangles. This type of charts is used to represent hierarchical data in a tree-like structure. Use this chart when data is organized hierarchically and has fewer categories.
Sample Image | Description |
|---|---|
| ChartType.Treemap Represents a treemap chart. It is used to display large amount of hierarchical data without any space constraints. |
Refer to the following example code to add a treemap chart.
C#
// Enable enhanced shape and chart engines.
fpSpread1.Features.EnhancedShapeEngine = true;
fpSpread1.Features.EnhancedChartEngine = true;
// Treemap chart.
object[,] dataArray = {
    { "Region", "Subregion", "Country", "Population"},
    { "Asia", "Southern", "India", 9541854},
    {"","" , "Pakistan", 2003818},
    {"",""  , "Thailand", 4668149},
    {"","" , "Others", 1700300},
    {"", "Eastern", "China", 15045928},
    {"","" , "Japan", 5271852},
    {"","" , "Others", 1912273},
    {"", "South-Eastern","" , 9536576},
    {"", "Western", "", 2722989},
    {"", "Central","" , 7186065},
    { "Africa", "Eastern","" , 3043132},
    {"", "Western","" , 3819688},
    {"", "Northern","" , 2784677},
    {"", "Others","" , 2512021},
    { "Europe","" ,"" , 7448010},
    { "Others","" ,"" , 10117703}
};
for (int i = 0; i < dataArray.GetLength(0); i++)
{
   for (int j = 0; j < dataArray.GetLength(1); j++)
   {
       fpSpread1.AsWorkbook().ActiveSheet.Cells[i, j].Value = dataArray[i, j];
   }
}
fpSpread1.AsWorkbook().ActiveSheet.Cells["A1:D17"].Select();
fpSpread1.AsWorkbook().ActiveSheet.Shapes.AddChart(GrapeCity.Spreadsheet.Charts.ChartType.Treemap, 100, 150, 400, 300, false);
fpSpread1.AsWorkbook().ActiveSheet.ChartObjects[0].Chart.ChartTitle.Text = "Treemap chart";
VB
' Enable enhanced shape and chart engines.
fpSpread1.Features.EnhancedShapeEngine = True
fpSpread1.Features.EnhancedChartEngine = True
' Treemap chart.
Dim dataArray As Object(,) = {
    {"Region", "Subregion", "Country", "Population"},
    {"Asia", "Southern", "India", 9541854},
    {"", "", "Pakistan", 2003818},
    {"", "", "Thailand", 4668149},
    {"", "", "Others", 1700300},
    {"", "Eastern", "China", 15045928},
    {"", "", "Japan", 5271852},
    {"", "", "Others", 1912273},
    {"", "South-Eastern", "", 9536576},
    {"", "Western", "", 2722989},
    {"", "Central", "", 7186065},
    {"Africa", "Eastern", "", 3043132},
    {"", "Western", "", 3819688},
    {"", "Northern", "", 2784677},
    {"", "Others", "", 2512021},
    {"Europe", "", "", 7448010},
    {"Others", "", "", 10117703}
}
For i As Integer = 0 To dataArray.GetLength(0) - 1
    For j As Integer = 0 To dataArray.GetLength(1) - 1
        fpSpread1.AsWorkbook().ActiveSheet.Cells(i, j).Value = dataArray(i, j)
    Next
Next
fpSpread1.AsWorkbook().ActiveSheet.Cells("A1:D17").Select()
fpSpread1.AsWorkbook().ActiveSheet.Shapes.AddChart(GrapeCity.Spreadsheet.Charts.ChartType.Treemap, 100, 150, 400, 300, False)
fpSpread1.AsWorkbook().ActiveSheet.ChartObjects(0).Chart.ChartTitle.Text = "Treemap chart"