
-
Spread Windows Forms Product Documentation
- Getting Started
-
Developer's Guide
- Understanding the Product
- Working with the Component
- Spreadsheet Objects
- Ribbon Control
- Sheets
- Rows and Columns
- Headers
- Cells
- Cell Types
- Data Binding
- Customizing the Sheet Appearance
- Customizing Interaction in Cells
- Tables
- Pivot Table
- Understanding the Underlying Models
- Customizing Row or Column Interaction
- Formulas in Cells
- Sparklines
- Keyboard Interaction
- Events from User Actions
- File Operations
- Storing Excel Summary and View
- Printing
- Chart Control
- Enhanced Chart
- Customizing Drawing
- Touch Support with the Component
- Spread Designer Guide
- Assembly Reference
- Import and Export Reference
- Version Comparison Reference
Smooth Line Chart
You can highlight curvy trends and make the lines in the enhanced chart smoother and visually appealing without fitting the continuous data into a specific angle using the ISeries.Smooth property.
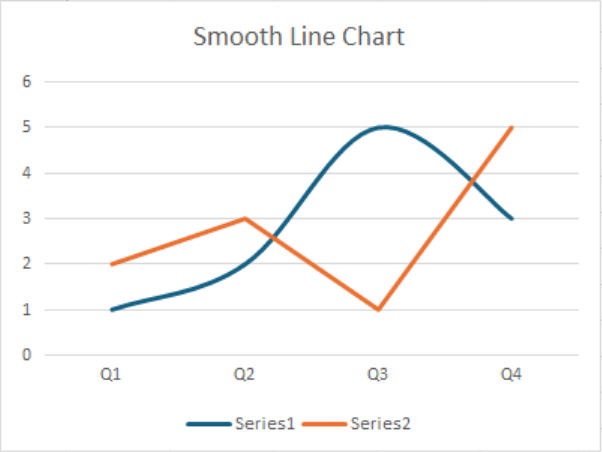
The following example demonstrates how to set a line as smooth in an enhanced chart.
C#
// Enable enhanced shape and chart engines.
fpSpread1.Features.EnhancedShapeEngine = true;
fpSpread1.Features.EnhancedChartEngine = true;

// Set data.
fpSpread1.AsWorkbook().ActiveSheet.SetValue(1, 1, new object[,]
{
  { "Q1", "Q2", "Q3", "Q4"},
  { 1, 2, 5, 3},
  { 2, 3, 1, 5}
});
fpSpread1.AsWorkbook().ActiveSheet.Cells["B2:E4"].Select();
fpSpread1.AsWorkbook().ActiveSheet.Shapes.AddChart(GrapeCity.Spreadsheet.Charts.ChartType.Line, 300, 50, 400, 300);
var chart = fpSpread1.AsWorkbook().ActiveSheet.ChartObjects[0].Chart;
chart.ChartTitle.Text = "Smooth Line Chart";

// Enable smoothing for the first series in the chart.
chart.Series[0].Smooth = true;
VB
' Enable enhanced shape and chart engines.
fpSpread1.Features.EnhancedShapeEngine = True
fpSpread1.Features.EnhancedChartEngine = True

' Set data.
fpSpread1.AsWorkbook().ActiveSheet.SetValue(1, 1, New Object(,) {
    {"Q1", "Q2", "Q3", "Q4"},
    {1, 2, 5, 3},
    {2, 3, 1, 5}
})
fpSpread1.AsWorkbook().ActiveSheet.Cells("B2:E4").Select()
fpSpread1.AsWorkbook().ActiveSheet.Shapes.AddChart(GrapeCity.Spreadsheet.Charts.ChartType.Line, 300, 50, 400, 300)
Dim chart = fpSpread1.AsWorkbook().ActiveSheet.ChartObjects(0).Chart
chart.ChartTitle.Text = "Smooth Line Chart"

' Enable smoothing for the first series in the chart.
chart.Series(0).Smooth = True