


- Document Solutions for Excel Java Overview
- Key Features
- Getting Started
-
Features
- Worksheet
- Workbook
- Comments
- Hyperlinks
- Sort
- Filter
- Group
- Conditional Formatting
- Data Validations
- Data Binding
- Import Data
- Digital Signatures
- Formulas
- Custom Functions
- Shapes
- Document Properties
- Styles
- Form Controls
- Barcodes
- Themes and Colors
- Chart
- Table
- Pivot Table
- Pivot Chart
- Sparkline
- Slicer
- Print Settings
- Logging
- Defined Names
- AI Assistant
- Templates
- Formula Reference
- File Operations
- Tutorials
- Use JDK 8 Date Time API
- Document Solutions Data Viewer
- API Reference
- Release Notes
Stock Chart
Stock chart is used to illustrate fluctuations in data over a time. It can represent fluctuations in stock, rainfall, or annual temperatures. The data arranged in columns or rows of a worksheet can be plotted in a Stock chart.
DsExcel supports the following types of Stock charts.
Chart Type | Chart Snapshot | Use Case |
|---|---|---|
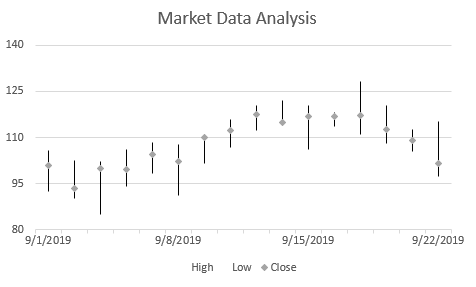
StockHLC |
| A high-low-close chart displays the data values organized in the order: high, low, close with the close value lying in between the high and low values. |
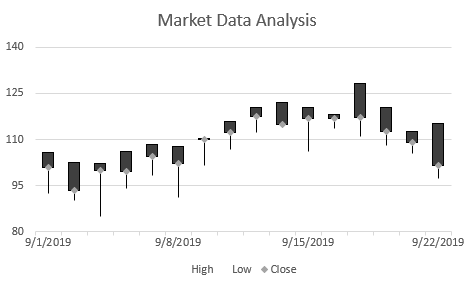
StockOHLC |
| An open-high-low-close chart displays the data values organized in the order: open, high, low and close. |
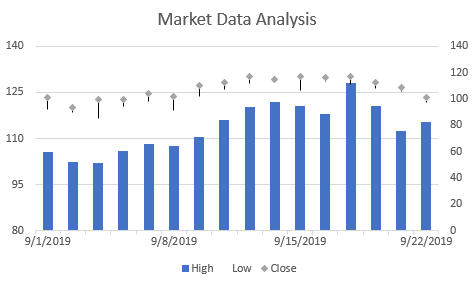
StockVHLC |
| A volume-high-low-close chart displays the data values organized in the order: volume, high, low and close. |
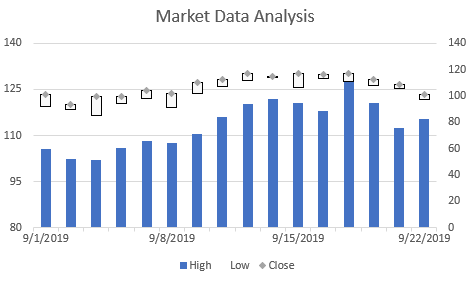
StockVOHLC |
| A volume-open-high-low-close chart displays the data values organized in the order : volume, open, high, low and close. |
Using Code
Refer the following code to add StockVOHLC chart:
private static void StockCharts() {
    // Initialize workbook
    Workbook workbook = new Workbook();
    // Fetch default worksheet
    IWorksheet worksheet = workbook.getWorksheets().get(0);

    // Prepare data for chart
    worksheet.getRange("A1:D17")
            .setValue(new Object[][] { { null, "High", "Low", "Close" },
                    { new GregorianCalendar(2019, 9, 1), 105.76, 92.38, 100.94 },
                    { new GregorianCalendar(2019, 9, 2), 102.45, 90.14, 93.45 },
                    { new GregorianCalendar(2019, 9, 3), 102.11, 85.01, 99.89 },
                    { new GregorianCalendar(2019, 9, 4), 106.01, 94.04, 99.45 },
                    { new GregorianCalendar(2019, 9, 5), 108.23, 98.16, 104.33 },
                    { new GregorianCalendar(2019, 9, 8), 107.7, 91.02, 102.17 },
                    { new GregorianCalendar(2019, 9, 9), 110.36, 101.62, 110.07 },
                    { new GregorianCalendar(2019, 9, 10), 115.97, 106.89, 112.39 },
                    { new GregorianCalendar(2019, 9, 11), 120.32, 112.15, 117.52 },
                    { new GregorianCalendar(2019, 9, 12), 122.03, 114.67, 114.75 },
                    { new GregorianCalendar(2019, 9, 15), 120.46, 106.21, 116.85 },
                    { new GregorianCalendar(2019, 9, 16), 118.08, 113.55, 116.69 },
                    { new GregorianCalendar(2019, 9, 17), 128.23, 110.91, 117.25 },
                    { new GregorianCalendar(2019, 9, 18), 120.55, 108.09, 112.52 },
                    { new GregorianCalendar(2019, 9, 19), 112.58, 105.42, 109.12 },
                    { new GregorianCalendar(2019, 9, 22), 115.23, 97.25, 101.56 },

    });
    worksheet.getRange("A:D").getColumns().autoFit();

    // Add Stock Chart
    IShape stockChartshape = worksheet.getShapes().addChart(ChartType.StockHLC, 350, 20, 360, 230);

    // Adding series to SeriesCollection
    stockChartshape.getChart().getSeriesCollection().add(worksheet.getRange("A1:D17"), RowCol.Columns);

    // Configure Chart Title
    stockChartshape.getChart().getChartTitle().setText("Market Data Analysis");

    // Configure value axis
    IAxis valueAxis = stockChartshape.getChart().getAxes().item(AxisType.Value);
    valueAxis.setMinimumScale(80);
    valueAxis.setMaximumScale(140);
    valueAxis.setMajorUnit(15);

    // Configure category axis
    IAxis categoryAxis = stockChartshape.getChart().getAxes().item(AxisType.Category);
    categoryAxis.setCategoryType(CategoryType.CategoryScale);
    categoryAxis.setMajorTickMark(TickMark.Outside);
    categoryAxis.setTickLabelSpacingIsAuto(false);
    categoryAxis.setTickLabelSpacing(5);

    // Configure Close Series Style
    ISeries series_close = stockChartshape.getChart().getSeriesCollection().get(2);
    series_close.setMarkerStyle(MarkerStyle.Diamond);
    series_close.setHas3DEffect(true);

    // Saving workbook to Xlsx
    workbook.save("23-StockChart.xlsx", SaveFileFormat.Xlsx);