
- Document Solutions for Excel Java Overview
- Key Features
- Getting Started
-
Features
- Worksheet
- Workbook
- Comments
- Hyperlinks
- Sort
- Filter
- Group
- Conditional Formatting
- Data Validations
- Data Binding
- Import Data
- Digital Signatures
- Formulas
- Custom Functions
- Shapes
- Document Properties
- Styles
- Form Controls
- Barcodes
- Themes and Colors
- Chart
- Table
- Pivot Table
- Pivot Chart
- Sparkline
- Slicer
- Print Settings
- Logging
- Defined Names
- AI Assistant
- Templates
- Formula Reference
- File Operations
- Tutorials
- Use JDK 8 Date Time API
- Document Solutions Data Viewer
- API Reference
- Release Notes
Create and Delete Chart
DsExcel Java enables users to add charts in spreadsheets for improved data analysis and enhanced data visualization. Users can create and delete chart using the methods of the IShapes interface and the IChart interface
Create Chart
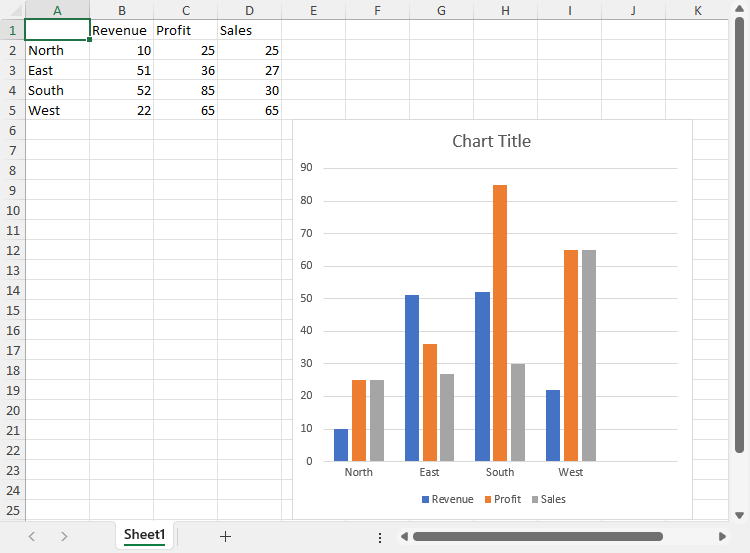
You can create chart in a worksheet by using the addChart method of the IShapes interface. Using this method, you can add a chart at a particular position by providing postion coordinates of the target range. The method has another overload that lets you add a chart directly to the target range. You can use add method of the ISeriesCollection class which lets you reflect data over the chart. To create a chart, refer to the following example code.
// Add Chart
IShape shape = worksheet.getShapes().addChart(ChartType.ColumnClustered, 200, 75, 300, 300);
worksheet.getRange("A1:D6").setValue(new Object[][] {
        { null, "Revenue", "Profit", "Sales" },
        { "North", 10, 25, 25 },
        { "East", 51, 36, 27},
        { "South", 52, 85, 30 },
        { "West", 22, 65, 65 }
});

// Create Chart
shape.getChart().getSeriesCollection().add(worksheet.getRange("A1:D6"), RowCol.Columns, true, true);

//Add Chart at a particular range
// IShape shapeRange = worksheet.getShapes.addChart(ChartType.ColumnClustered, worksheet.getRange["A8:E20"]);
//shapeRange.getChart().getSeriesCollection().add(worksheet.Range["A1:D6"], RowCol.Columns, true, true);
type=note
Note: The target range and the linked picture to be added must exist in the same worksheet. Otherwise, it results into an InvalidOperationException.
Delete Chart
You can delete an existing chart by using the delete method of the IChart interface. To delete a chart from your worksheet, refer to the following example code.
// Delete Chart
shape.getChart().delete();