- Document Solutions for Excel Java Overview
- Key Features
- Getting Started
-
Features
- Worksheet
- Workbook
- Comments
- Hyperlinks
- Sort
- Filter
- Group
- Conditional Formatting
- Data Validations
- Data Binding
- Import Data
- Digital Signatures
- Formulas
- Custom Functions
- Shapes
- Document Properties
- Styles
- Form Controls
- Barcodes
- Themes and Colors
- Chart
- Table
- Pivot Table
- Pivot Chart
- Sparkline
- Slicer
- Print Settings
- Logging
- Defined Names
- AI Assistant
- Templates
- Formula Reference
- File Operations
- Tutorials
- Use JDK 8 Date Time API
- Document Solutions Data Viewer
- API Reference
- Release Notes
Statistical Chart
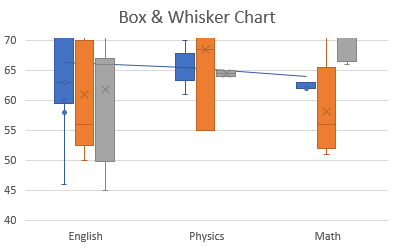
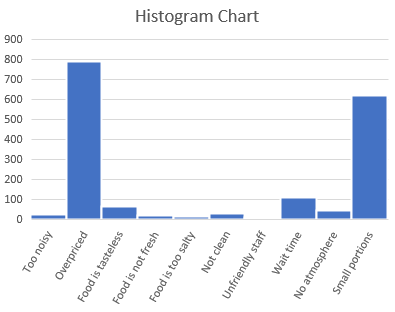
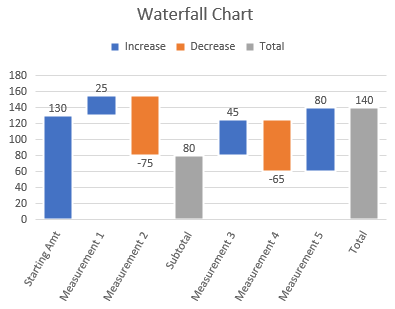
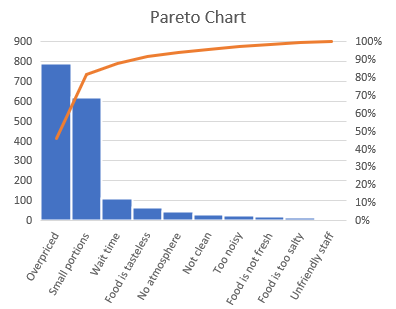
Statistical charts can be used to present and interpret statistical data in graphical format. DsExcel supports statistical chart types like Box and Whisker, Histogram, Waterfall and Pareto. Such chart types add visual meaning to the represented data.
DsExcel supports the following types of Statistical chart types:
Chart Type | Chart Snapshot | Use Case |
|---|---|---|
| Box and Whisker charts are often used in Marketing Analysis, Statistical Analysis and General Analysis. | |
| Histogram is a common chart used in statistics. It can be used in scenarios, such as analysis of distribution/sales of books in a book store. | |
| Waterfall charts finds application in analyzing project gains including the number of contracts carried forwarded each year, contracts cancelled, tasks completed etc. | |
| Pareto charts graphically summarize the process problems in ranking order from the most frequent to the least one. |