
- Document Solutions for Excel, Java Edition Overview
- Key Features
- Getting Started
-
Features
- Worksheet
- Workbook
- Comments
- Hyperlinks
- Sort
- Filter
- Group
- Conditional Formatting
- Data Validations
- Data Binding
- Import Data
- Digital Signatures
- Formulas
- Custom Functions
- Shapes
- Document Properties
- Styles
- Form Controls
- Barcodes
- Themes and Colors
- Chart
- Table
- Pivot Table
- Pivot Chart
- Sparkline
- Slicer
- Print Settings
- Logging
- Defined Names
- Templates
- File Operations
- Use JDK 8 Date Time API
- Document Solutions Data Viewer
- API Reference
- Release Notes
Surface Chart
Surface charts are useful when you want to find the optimum combinations between two data sets. As in a topographic map, the colors and patterns indicate the areas that are in the same range of values. A surface chart plots data on a three-dimensional surface, in a similar way that topographic maps plots elevation. The colors and patterns represent values within the same range. This chart type is especially useful for finding the optimum results when comparing two or more sets of data.
DsExcel supports the following types of Surface charts.
Chart Type | Chart Snapshot | Purpose |
|---|---|---|
Surface |
| Surface chart is a chart with a 3-D visual effect. |
SurfaceTopView |
| SurfaceTopView chart depicts surface chart viewed from above. |
SurfaceTopViewWireframe |
| SurfaceTopViewWireframe chart depicts surface chart viewed from above with no fill color. |
SurfaceWireframe |
| SurfaceWireframe chart depicts surface chart with a 3-D visual effect and no fill color. |
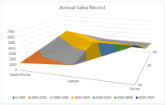 Surface chart
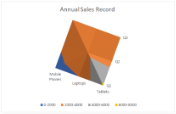 SurfaceTopView chart
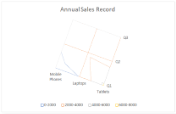 SurfaceTopViewWireframe chart
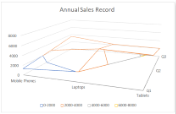 SurfaceWireframe chart
Using Code
Refer to the following code to add SurfaceWireframe chart.
private static void SurfaceCharts() {
    // Initialize workbook
    Workbook workbook = new Workbook();
    // Fetch default worksheet
    IWorksheet worksheet = workbook.getWorksheets().get(0);
    // Prepare data for chart
    worksheet.getRange("A1:D4")
            .setValue(new Object[][] {
                { null, "Q1", "Q2", "Q3" },
                { "Mobile Phones", 1330, 2345, 3493 },
                { "Laptops", 2032, 3632, 2197 },
                { "Tablets", 6233, 3270, 2030 } });
    worksheet.getRange("A:D").getColumns().autoFit();
    // Add Surface Chart
    IShape areaChartShape = worksheet.getShapes().addChart(ChartType.Surface, 250, 20, 360, 230);

    // Adding series to SeriesCollection
    areaChartShape.getChart().getSeriesCollection().add(worksheet.getRange("A1:D4"), RowCol.Columns, true, true);

    // Configure Chart Title
    areaChartShape.getChart().getChartTitle().getTextFrame().getTextRange().getParagraphs()
            .add("Annual Sales Record");

    // Saving workbook to Xlsx
    workbook.save("25-SurfaceChart.xlsx", SaveFileFormat.Xlsx);