
- Document Solutions for Excel, .NET Edition Overview
- Key Features
- Getting Started
-
Features
- Worksheet
- Workbook
- Comments
- Hyperlinks
- Sort
- Filter
- Group
- Conditional Formatting
- Data Validations
- Data Binding
- Import Data
- Digital Signatures
- Formulas
- Custom Functions
- Shapes
- Document Properties
- Styles
- Form Controls
- Barcodes
- Themes and Colors
- Chart
- Table
- Pivot Table
- Pivot Chart
- Sparkline
- Slicer
- Logging
- Defined Names
- AI Assistant
- Templates
- Formula Reference
- File Operations
- Document Solutions Data Viewer
- API Reference
- Release Notes
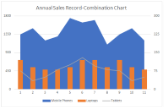
Combo Chart
Combo chart is a combination of two or more chart types in a single plot area. For instance, a bar and line chart in a single plot. Combination charts are best used to compare the different data sets that are related to each other, such as actual and target values, total revenue and profit, temperature and precipitation etc. Note that these charts may require multiple axes to cater different scales.
Chart Type | Chart Snapshot | Use Case |
|---|---|---|
Combo |
Combo chart | Combo chart can be used to interpret and understand different type of data that is completely unrelated (for instance: price and volume) or to plot one or more data series on the secondary axis. |
Using Code
Refer to the following example code to add Combo Chart:
// Initialize workbook
Workbook workbook = new Workbook();
// Fetch default worksheet
IWorksheet worksheet = workbook.Worksheets[0];

// Prepare data for chart
worksheet.Range["A1:C17"].Value = new object[,] {
    { "Mobile Phones", "Laptops", "Tablets" },
    { 1350, 120, 75 },
    { 1500, 90, 35 },
    { 1200, 80, 50 },
    { 1300, 80, 80 },
    { 1750, 90, 100 },
    { 1640, 120, 130 },
    { 1700, 120, 95 },
    { 1100, 90, 80 },
    { 1350, 120, 75 },
    { 1500, 90, 35 },
    { 1200, 80, 50 },
};
worksheet.Range["A:C"].Columns.AutoFit();

// Add Combination Chart
IShape comboChartShape = worksheet.Shapes.AddChart(ChartType.Area, 250, 20, 360, 230);
// Adding series to SeriesCollection
comboChartShape.Chart.SeriesCollection.Add(worksheet.Range["A1:C17"], RowCol.Columns);

// Configure Chart Title
comboChartShape.Chart.ChartTitle.Text = "Annual Sales Record-Combination Chart";
ISeries series1 = comboChartShape.Chart.SeriesCollection[0];
ISeries series2 = comboChartShape.Chart.SeriesCollection[1];
ISeries series3 = comboChartShape.Chart.SeriesCollection[2];

//Change series type to make it Combination chart of different ChartTypes
series1.ChartType = ChartType.Area;
series2.ChartType = ChartType.ColumnStacked;
series3.ChartType = ChartType.Line;

//Set axis group
series2.AxisGroup = AxisGroup.Secondary;
series3.AxisGroup = AxisGroup.Secondary;

//Configure axis scale and unit
IAxis value_axis = comboChartShape.Chart.Axes.Item(AxisType.Value);
IAxis value_second_axis = comboChartShape.Chart.Axes.Item(AxisType.Value, AxisGroup.Secondary);
value_axis.MaximumScale = 1800;
value_axis.MajorUnit = 450;
value_second_axis.MaximumScale = 300;
value_second_axis.MajorUnit = 75;

// Saving workbook to Xlsx
workbook.Save("24-ComboChart.xlsx", SaveFileFormat.Xlsx);