
Mixed Charts
You can add multiple series to your charts and set a different ChartType for each series. Such charts are helpful in analyzing complex chart data on a single canvas. The same data can be used with different visualizations or related data can be displayed together to convey trends.
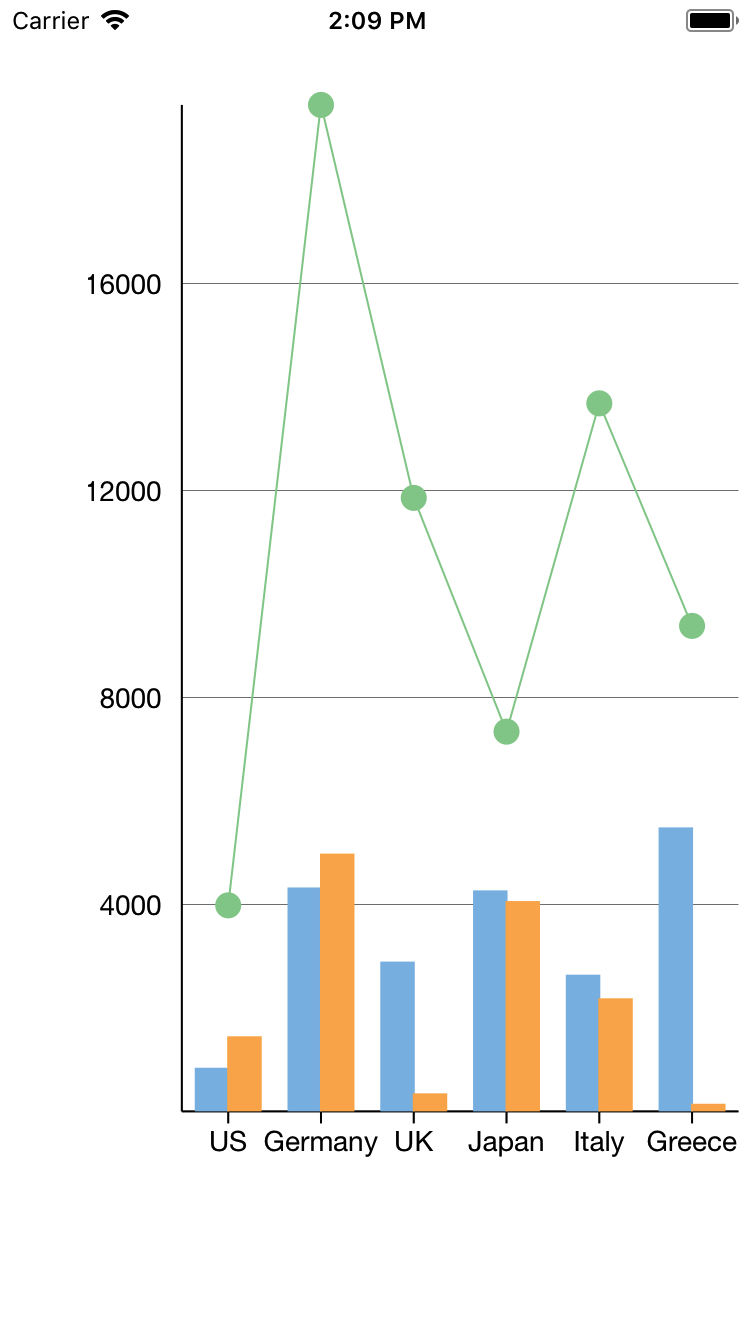
The following image shows a FlexChart with multiple series.
The following code example demonstrates how to create multiple instances of type ChartSeries with different ChartTypes and add them to the FlexChart.
Add a new class, SalesData, to the application serve as the data source for the FlexChart control.
class SalesData
{
    #region ** fields
    static Random _rnd = new Random();
    static string[] _countries = new string[] { "US", "Germany", "UK", "Japan", "Italy", "Greece" };
    #endregion
    #region ** initialization
    public SalesData()
    {
        this.Name = string.Empty;
        this.Sales = 0;
        this.Expenses = 0;
        this.Downloads = 0;
        this.Date = DateTime.Now;
    }
    public SalesData(string name, double sales, double expenses, double downloads, DateTime date)
    {
        this.Name = name;
        this.Sales = sales;
        this.Expenses = expenses;
        this.Downloads = downloads;
        this.Date = date;
    }
    #endregion
    #region ** object model
    [Export("Name")]
    public string Name { get; set; }
    [Export("Sales")]
    public double Sales { get; set; }
    [Export("Expenses")]
    public double Expenses { get; set; }
    [Export("Downloads")]
    public double Downloads { get; set; }
    public DateTime Date { get; set; }
    [Export("Date")]
    public NSDate iOSDate
    {
        get
        {
            return DateTimeToNSDate(Date);
        }
        set
        {
            Date = NSDateToDateTime(value);
        }
    }
    #endregion
    #region ** implementation
    // ** static list provider
    public static List<SalesData> GetSalesDataList()
    {
        List<SalesData>  array = new List<SalesData> ();
        for (int i = 0; i < GetCountries().Length; i++)
        {
            array.Add(new SalesData
            {
                Sales = _rnd.NextDouble() * 10000,
                Expenses = _rnd.NextDouble() * 5000,
                Downloads = _rnd.Next(20000),
                Date = DateTime.Now.AddDays(i),
                Name = GetCountries()[i]
            });
        }
        return array;
    }
    public static List<SalesData> GetSalesDataList2()
    {
        List<SalesData> array = new List<SalesData>();
        for (int i = 0; i < GetCountries().Length; i++)
        {
            array.Add(new SalesData
            {
                Sales = _rnd.Next(100) * 100,
                Expenses = _rnd.Next(100) * 50,
                Downloads = _rnd.Next(100),
                Date = DateTime.Now.AddDays(i),
                Name = GetCountries()[i]
            });
        }
        return array;
    }
    public NSDate DateTimeToNSDate(DateTime date)
    {
        if (date.Kind == DateTimeKind.Unspecified)
            date = DateTime.SpecifyKind(date, DateTimeKind.Utc);
        return (NSDate)date;
    }
    public DateTime NSDateToDateTime(NSDate date)
    {
        // NSDate has a wider range than DateTime, so clip
        // the converted date to DateTime.Min|MaxValue.
        double secs = date.SecondsSinceReferenceDate;
        if (secs < -63113904000)
            return DateTime.MinValue;
        if (secs > 252423993599)
            return DateTime.MaxValue;
            return (DateTime)date;
    }
    // ** static value providers
    public static string[] GetCountries() { return _countries; }
    #endregion
}
Add the following code to the ViewDidLoad() method to create mixed charts.
chart.BindingX = "Name";
chart.Series.Add(new ChartSeries() { SeriesName = "Sales", Binding = "Sales,Sales" });
chart.Series.Add(new ChartSeries() { SeriesName = "Expenses", Binding = "Expenses,Expenses" });
chart.Series.Add(new ChartSeries() { SeriesName = "Downloads", Binding = "Downloads,Downloads", ChartType = C1.iOS.Chart.ChartType.LineSymbols });
chart.ItemsSource = SalesData.GetSalesDataList();