
Data Labels
You can add data labels in the FlexChart to show the exact values corresponding to a particular column, bar or point in the chart area. The position property of the FlexChart data labels can be used to set the position of the data labels. Users can set data labels at the following positions.
- TOP - Displays data labels on the top of the column, bar or point in the chart area
- BOTTOM - Displays data labels below the edge of the column, bar or point in the chart area
- RIGHT - Displays data labels to the right side of the column, bar or point in the chart area
- LEFT - Displays data labels to the left side of the column, bar or point in the chart area
- CENTER - Displays data labels to the center of the column, bar or point in the chart area
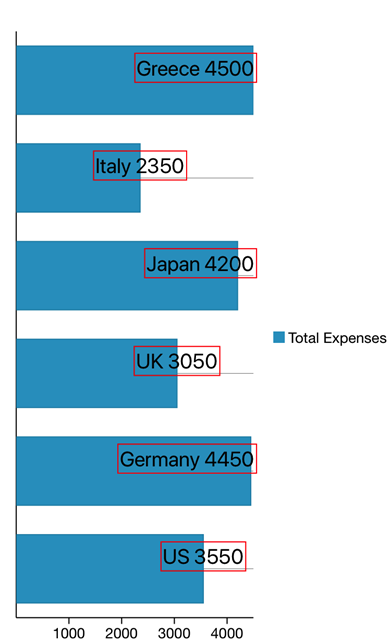
The image given below shows a FlexChart control that displays sales data with data labels corresponding to months.
The following code example shows how to set data labels for FlexChart control.
chart = new FlexChart();
chart.ChartType = ChartType.Bar;
chart.BindingX = "Name";
chart.Series.Add(new ChartSeries() { SeriesName = "Total Expenses", Binding = "Expenses" });
chart.ItemsSource = SalesData.GetSalesDataList2();
chart.Palette = Palette.Modern;
chart.AxisY.AxisLine = true;
chart.AxisY.Labels = false;
this.Add(chart);
chart.DataLabel.Position = ChartLabelPosition.Top;
chart.DataLabel.Content = "{x} {y}";
chart.DataLabel.Border = true;
chart.DataLabel.BorderStyle = new ChartStyle { Stroke = UIColor.Red, StrokeThickness = 1 };
chart.DataLabel.Style = new ChartStyle { FontFamily = UIFont.SystemFontOfSize(20, UIFontWeight.Black) };
this.Add(chart);