Tooltip
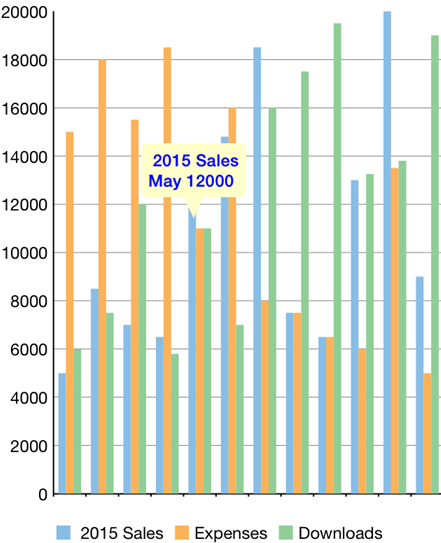
Tooltips are the labels that appear when users hover over data points on your chart. They appear on FlexChart by default, and can display any combination of data values and text. A tooltip generally displays the name of the legend along with the X and Y values of the selected point. FlexChart allows you to customize the tooltip's background color, text color, tooltip delay etc. using the tooltip property.
The image below shows how a tooltip appears on FlexChart.

The following code examples demonstrate how to customize the tooltip. The example uses the sample created in the Quick Start section.
In Code
chart.ToolTip.IsOpen = true;chart.ToolTip.BackgroundColor = UIColor.FromRGBA(1, 1, 0, 1);chart.ToolTip.TextColor = UIColor.Blue;

