Data Labels
You can add static data labels in the FlexPie to show the exact values corresponding to each slice of the pie. You can choose to set data labels at the following positions:
- None - No data labels.
- Inside- Displays data labels within the pie.
- Center- Displays data labels right in the center of the pie.
- Outside- Displays data labels outside the pie.
- Radial- Displays data labels inside the pie slice and depends on its angle.
- Circular - Displays data labels inside the pie slice in circular direction.
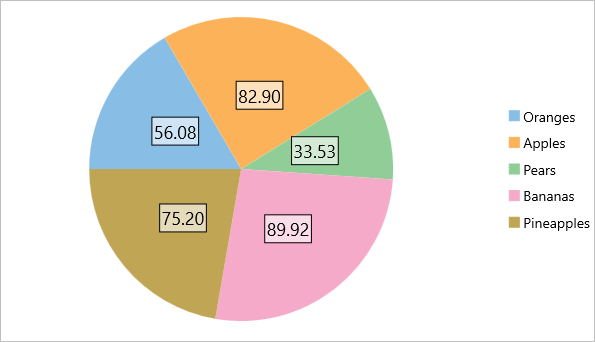
The following image shows a FlexPie with data labels displayed in the Center.
A data label can contain any amount of text and other UI elements. To display data labels in a FlexPie control, you must set the PieDataLabel.Position property and define the content template to display as the label.
In Code
To add data label and set its position in FlexPie chart, use the following code in C#.
//Adding data labels and setting position
chart.DataLabel.Position = PieLabelPosition.Center;
chart.DataLabel.Border = true;
chart.DataLabel.Content = "{}{value:F2}";
chart.DataLabel.Style.Fill = Color.FromHex("#99FFFFFF");
chart.DataLabel.Style.FontSize = 18;
In XAML
To add data label and set its position in FlexPie chart, add the following markup between the <c1:FlexPie></c1:FlexPie> tags in XAML code.
<c1:FlexPie.DataLabel>
    <c1:PieDataLabel Position="Center" Border="True" Content="{}{value:F2}">
        <c1:PieDataLabel.Style >
            <c1:ChartStyle Fill="#99FFFFFF" FontSize="18" ></c1:ChartStyle>
        </c1:PieDataLabel.Style>
    </c1:PieDataLabel>
</c1:FlexPie.DataLabel>
The data context for the label is an instance of PieDataPoint, which exposes the following properties:
| Parameter | Description |
|---|---|
| x | Show the X value of the data point. |
| y | Show the Y value of the data point. |
| value | Show the Y value of the data point. |
| name | Show the X value of the data point. |
| seriesName | Shows the name of the series. |
| pointIndex | Shows the index of the data point. |
| Percentage | Shows the percentage of a pie slice to the whole pie chart. |
To display percentage values as the data labels, you would bind a Xamarin.Forms Label to 'Percentage' as shown below.
In XAML
<c1:FlexPie.DataLabel>
    <c1:PieDataLabel Position="Center" Border="True" Content="{}{Percentage}">
        <c1:PieDataLabel.Style >
            <c1:ChartStyle Fill="#99FFFFFF" FontSize="18" ></c1:ChartStyle>
        </c1:PieDataLabel.Style>
    </c1:PieDataLabel>
</c1:FlexPie.DataLabel>
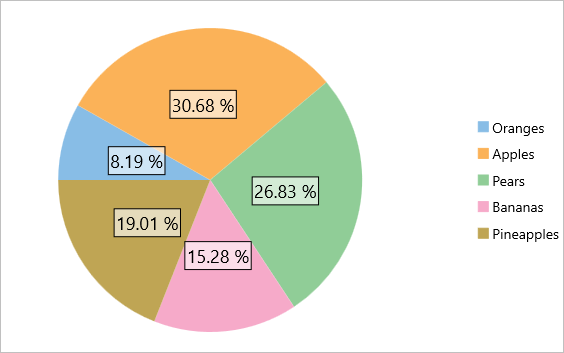
The following image shows a FlexPie displaying percentage values.