
Legend
Legend displays an entry for each data series in the chart. It allows you to identify the corresponding data represented in charts. In FlexPie, you can customize the legend of charts in various ways. For example, you can change the orientation and position of legends. Let us understand them in detail:
- Orientation: Specifies the orientation of the legend using the LegendOrientation property of the FlexChartBase class. The LegendOrientation property sets the orientation of chart legend to Horizontal, Vertical, or Auto using the Orientation enumeration.
- Position: Specifies the position where you want to display the legend using the LegendPosition property of the FlexChartBase class. The LegendPosition property sets the position of the legend on Top, Bottom, Left, Right, TopLeft, TopRight, BottomLeft, or BottomRight of the chart by using the Position enumeration. Setting the LegendPosition property to None hides the legend.
The following code snippet shows how to set the property.
xml
<Grid>
    <Chart:C1FlexPie
        x:Name="flexPie"
        InnerRadius="0.5"
        Offset="0.5"
        Header="Fruit Sales Data"
        Footer="2015"
        LegendOrientation="Horizontal"
        LegendPosition="Bottom"
        SelectionMode="Point"
        SelectedItemPosition="Top"
        SelectedItemOffset="2"
        Margin="95,99,328,275"
        Binding="April"
        BindingName="Fruit"
        ItemsSource="{Binding DataContext.Data}">
        <Chart:C1FlexPie.SelectionStyle>
            <Chart:ChartStyle Stroke="Red"
                              StrokeThickness="2"/>
        </Chart:C1FlexPie.SelectionStyle>
        <Chart:C1FlexPie.DataLabel>
            <Chart:PieDataLabel Content="{}{y}"/>
        </Chart:C1FlexPie.DataLabel>
    </Chart:C1FlexPie>
</Grid>
Code
flexPie.LegendOrientation = C1.Chart.Orientation.Horizontal;
flexPie.LegendPosition = C1.Chart.Position.Bottom;
Legend Formatting
Each legend label should be concise and descriptive, clearly indicating the category or data points it represents. FlexPie allow you to format such legend items using the LegendItemFormat event provided by the FlexChartBase class.
The following image displays FlexPie with the formatted legend labels.
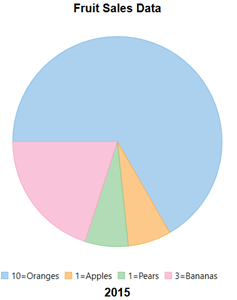
The following code snippet shows how the legend labels are formatted.
flexPie.LegendItemFormat += (s, e) =>
{
    var data = (FruitDataItem)e.Item;
    e.Text = $"{data.April}={data.Fruit}";
};