
Heat Map
Heat maps are the graphical representations that use color coding to plot the two dimensional data. The primary purpose of heat maps is to identify patterns, areas of concentration, and data variance. Some of the real life examples where heat maps could be used are temperature records or demonstrating weekly traffic intensity.
Depending on the type of data used, heat maps can be created using two types of visual representations: category-based heat maps and value-based heat maps.
Category based WinForms Heat Map
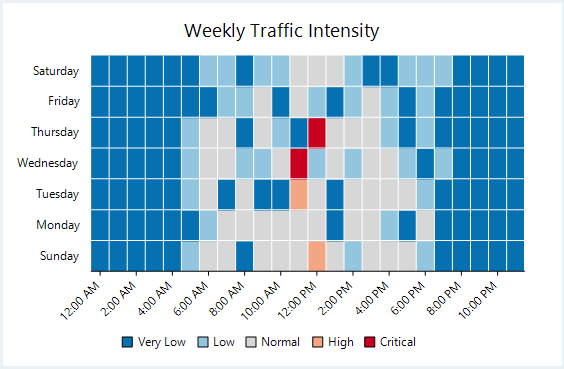
Category-based heat maps are used to plot data against intervals or specific numeric ranges. To create a category-based WinForms heat map using FlexChart, you need to create an instance of the DiscreteColorScale class. This class provides the Intervals property which allows you to get or set the collection of intervals. You can define the intervals by setting the Min, Max, Color and Name properties of each interval. These user-defined intervals form legend of the heat map. Next step is to create a Heatmap series, supply data to it by setting the DataSource property and set its ColorScale property to the DiscreteColorScale object.
//Set the FlexChart header content
this.flexChart1.Header.Content = "Weekly Traffic Intensity";
//Get data
var data = Get2DTrafficData();
//Define categories for HeatMap and their range
var discreteScale = new DiscreteColorScale
{
    Intervals = new List<DiscreteColorScale.Interval>
    {
        new DiscreteColorScale.Interval(0, 10, Color.FromArgb(0x05,0x71,0xB0), "Very Low"),
        new DiscreteColorScale.Interval(10, 25, Color.FromArgb(0x92, 0xC5, 0xDE), "Low"),
        new DiscreteColorScale.Interval(25, 75, Color.FromArgb(0xD7, 0xD7, 0xD7), "Normal"),
        new DiscreteColorScale.Interval(75, 90, Color.FromArgb(0xF4, 0xA5, 0x82), "High"),
        new DiscreteColorScale.Interval(90, 100, Color.FromArgb(0xCA, 0x00, 0x20), "Critical"),
    }
};
//Create HeapMap and define scale for colors and pass data to it
var heatmap = new Heatmap
{
    ColorScale = discreteScale,
    DataSource = data.Values,
};
//Add HeatMap as series in FlexChart
this.flexChart1.Series.Add(heatmap);
#region Axis Style
//Define Min and Max for AxisX according to data
this.flexChart1.AxisX.Min = heatmap.StartX;
this.flexChart1.AxisX.Max = data.Values.GetLength(0) + heatmap.StartX;
//Set AxisX grid line settings
this.flexChart1.AxisX.MinorGrid = true;
this.flexChart1.AxisX.MinorGridStyle.StrokeColor = Color.White;
this.flexChart1.AxisX.LabelAngle = 45;
//Set AxisY grid line settings
this.flexChart1.AxisY.MajorGrid = false;
this.flexChart1.AxisY.MinorGrid = true;
this.flexChart1.AxisY.MinorGridStyle.StrokeColor = Color.White;
//Pass data to FlexChart Axes
this.flexChart1.AxisX.DataSource = data.CatXData;
this.flexChart1.AxisY.DataSource = data.CatYData;
' Method for initializing HeatMap
Protected Sub SetupHeatMap()
'Clearing series collection of FlexChart
Me.flexChart1.Series.Clear()
'Set the FlexChart header content
Me.flexChart1.Header.Content = "Weekly Traffic Intensity"
'Get data
Dim data As TwoDDataItem = Get2DTrafficData()
'Define categories for HeatMap and their range
Dim discreteScale As DiscreteColorScale = New DiscreteColorScale() With {
.Intervals = New List(Of DiscreteColorScale.Interval)() From {
New DiscreteColorScale.Interval(0, 10, Color.FromArgb(&H5, &H71, &HB0), "Very Low"),
New DiscreteColorScale.Interval(10, 25, Color.FromArgb(&H92, &HC5, &HDE), "Low"),
New DiscreteColorScale.Interval(25, 75, Color.FromArgb(&HD7, &HD7, &HD7), "Normal"),
New DiscreteColorScale.Interval(75, 90, Color.FromArgb(&HF4, &HA5, &H82), "High"),
New DiscreteColorScale.Interval(90, 100, Color.FromArgb(&HCA, &H0, &H20), "Critical")
}
}
'Create HeapMap and define scale for colors and pass data to it
Dim heatmap As Heatmap = New Heatmap() With {
.ColorScale = discreteScale,
.DataSource = data.Values
}
'Add HeatMap as series in FlexChart
Me.flexChart1.Series.Add(heatmap)
#Region "Axis Style"
'Define Min and Max for AxisX according to data
Me.flexChart1.AxisX.Min = heatmap.StartX
Me.flexChart1.AxisX.Max = data.Values.GetLength(0) + heatmap.StartX
'Set AxisX grid line settings
Me.flexChart1.AxisX.MinorGrid = True
Me.flexChart1.AxisX.MinorGridStyle.StrokeColor = Color.White
Me.flexChart1.AxisX.LabelAngle = 45
'Set AxisY grid line settings
Me.flexChart1.AxisY.MajorGrid = False
Me.flexChart1.AxisY.MinorGrid = True
Me.flexChart1.AxisY.MinorGridStyle.StrokeColor = Color.White
'Pass data to FlexChart Axes
Me.flexChart1.AxisX.DataSource = data.CatXData
Me.flexChart1.AxisY.DataSource = data.CatYDataNote that the above sample code uses a custom method named Get2DTrafficData to supply data to the chart. You can set up the data source as per your requirements.
// Method for creating data for HeatMap
Random rnd = new Random();
public TwoDDataItem Get2DTrafficData()
{
    var data = new double[24, 7];
    for (var j = 0; j < 7; j++)
        for (var i = 0; i < 24; i++)
            data[i, j] = 10 * Math.Exp(-(i - 12) * (i - 12) / (2 * 4.0 * 4.0)) / Math.Sqrt(2 * Math.PI * 4.0 * 4.0) * ((j == 5 || j == 6) ? 50 : 100) * rnd.NextDouble();
    var times = new string[24];
    for (var i = 0; i < 24; i++)
        times[i] = new DateTime(2000, 1, 1, i, 0, 0).ToShortTimeString();
    var days = Enum.GetNames(typeof(DayOfWeek));
    return new TwoDDataItem(data, times, days);
}
' Method for creating data for HeatMap
Private rnd As New Random()
Public Function Get2DTrafficData() As TwoDDataItem
Dim data As Double(,) = New Double(23, 6) {}
For j As Integer = 0 To 6
For i As Integer = 0 To 23
data(i, j) = 10 * Math.Exp(-(i - 12) * (i - 12) / (2 * 4.0 * 4.0)) / Math.Sqrt(2 * Math.PI * 4.0 * 4.0) * (If((j = 5 OrElse j = 6), 50, 100)) * rnd.NextDouble()
Next
Next
Dim times As String() = New String(23) {}
For i As Integer = 0 To 23
times(i) = New DateTime(2000, 1, 1, i, 0, 0).ToShortTimeString()
Next
Dim days As String() = [Enum].GetNames(GetType(DayOfWeek))
Return New TwoDDataItem(data, times, days)
End FunctionValue based WinForms Heat Map
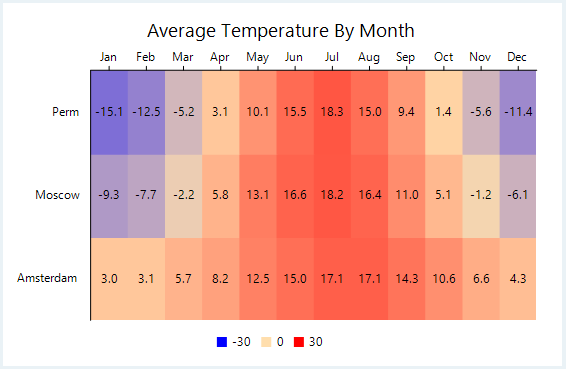
Value-based heat maps are used to plot the raw data values without dividing them into the intervals. To create a value-based WinForms heat map using FlexChart, you need to create an instance of the GradientColorScale class. The legend of a value based heat map is generated with each entry corresponding to a numeric value between the Min and Max values. The interval between these values is calculated based on the formula (|Min| + |Max|)/(n-1) where n refers to the number of colors specified in the Colors property. Next step is to create a Heatmap series, supply data to it by setting the DataSource property and set its ColorScale property to the GradientColorScale object.
For example, a simple custom palette containing red, white and blue color maps the values from -30 to 30 to shades of red, white, blue, where -30 is mapped to red and 30 to blue.
//Set the FlexChart header content
this.flexChart1.Header.Content = "Average Temperature By Month";
//Get data
var data = Get2DTempData();
//Define gradient scale for HeatMap and its range
var gradientScale = new GradientColorScale
{
    Min = -30,
    Max = 30,
    Colors = new List<Color>
    {
        Color.Blue,
        Color.NavajoWhite,
        Color.Red
    }
};
//Hiding legends as the values change gradually in along the gradient axis
this.flexChart1.Legend.Position = Position.Bottom;
//Create HeapMap and define scale for colors and pass data to it
var heatmap = new Heatmap()
{
    ColorScale = gradientScale,
    DataSource = data.Values,
};
//Add HeatMap as series in FlexChart
this.flexChart1.Series.Add(heatmap);
//Format data label and set its Position
this.flexChart1.DataLabel.Content = "{item:0.0}";
this.flexChart1.DataLabel.Position = LabelPosition.Center;
#region Axis Style
this.flexChart1.AxisX.Position = Position.Top;
this.flexChart1.AxisY.Min = heatmap.StartX;
this.flexChart1.AxisY.Max = data.Values.GetLength(0) + heatmap.StartX;
this.flexChart1.AxisY.MajorGrid = false;
this.flexChart1.AxisY.AxisLine = true;
//Pass data to FlexChart Axes
this.flexChart1.AxisX.DataSource = data.CatXData;
this.flexChart1.AxisY.DataSource = data.CatYData;
this.flexChart1.Rotated = true;
' Method for initializing HeatMap
Protected Sub SetupHeatMap()
'Clearing series collection of FlexChart
Me.flexChart1.Series.Clear()
'Set the FlexChart header content
Me.flexChart1.Header.Content = "Average Temperature By Month"
'Get data
Dim data As TwoDDataItem = Get2DTempData()
'Define gradient scale for HeatMap and its range
Dim gradientScale As GradientColorScale = New GradientColorScale() With {
.Min = -30,
.Max = 30,
.Colors = New List(Of Color)() From {
Color.Blue,
Color.NavajoWhite,
Color.Red
}
}
'Hiding legends as the values change gradually in along the gradient axis
Me.flexChart1.Legend.Position = Position.Bottom
'Create HeapMap and define scale for colors and pass data to it
Dim heatmap As Heatmap = New Heatmap() With {
.ColorScale = gradientScale,
.DataSource = data.Values
}
'Add HeatMap as series in FlexChart
Me.flexChart1.Series.Add(heatmap)
'Format data label and set its Position
Me.flexChart1.DataLabel.Content = "{item:0.0}"
Me.flexChart1.DataLabel.Position = LabelPosition.Center
#Region "Axis Style"
Me.flexChart1.AxisX.Position = Position.Top
Me.flexChart1.AxisY.Min = heatmap.StartX
Me.flexChart1.AxisY.Max = data.Values.GetLength(0) + heatmap.StartX
Me.flexChart1.AxisY.MajorGrid = False
Me.flexChart1.AxisY.AxisLine = True
'Pass data to FlexChart Axes
Me.flexChart1.AxisX.DataSource = data.CatXData
Me.flexChart1.AxisY.DataSource = data.CatYData
Me.flexChart1.Rotated = TrueNote that the above sample code uses a custom method named Get2DTempData to supply data to the chart. You can set up the data source as per your requirements.
// Method for creating data for HeatMap
public static TwoDDataItem Get2DTempData()
{
    var data = new double[,]
    {
        {  3.0, 3.1, 5.7, 8.2, 12.5, 15.0, 17.1, 17.1, 14.3, 10.6, 6.6, 4.3 },
        { -9.3, -7.7, -2.2, 5.8, 13.1, 16.6, 18.2, 16.4, 11.0, 5.1, -1.2, -6.1},
        { -15.1, -12.5, -5.2, 3.1, 10.1, 15.5, 18.3, 15.0, 9.4, 1.4, -5.6, -11.4},
    };
    var months = new string[] { "Jan", "Feb", "Mar", "Apr", "May", "Jun", "Jul", "Aug", "Sep", "Oct", "Nov", "Dec" };
    var areas = new string[] { "Amsterdam", "Moscow", "Perm" };
    return new TwoDDataItem(data, months, areas);
}
' Method for creating data for HeatMap
Public Shared Function Get2DTempData() As TwoDDataItem
Dim data As Double(,) = New Double(,) {{3.0, 3.1, 5.7, 8.2, 12.5, 15.0,
17.1, 17.1, 14.3, 10.6, 6.6, 4.3}, {-9.3, -7.7, -2.2, 5.8, 13.1, 16.6,
18.2, 16.4, 11.0, 5.1, -1.2, -6.1}, {-15.1, -12.5, -5.2, 3.1, 10.1, 15.5,
18.3, 15.0, 9.4, 1.4, -5.6, -11.4}}
Dim months As String() = New String() {"Jan", "Feb", "Mar", "Apr", "May", "Jun",
"Jul", "Aug", "Sep", "Oct", "Nov", "Dec"}
Dim areas As String() = New String() {"Amsterdam", "Moscow", "Perm"}
Return New TwoDDataItem(data, months, areas)
End FunctionUse Gradient Legend
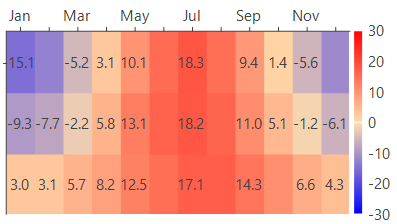
By default, like any other chart, a heat map also gets generated with a legend. However, the default chart legend of a heat map can be replaced with a gradient chart legend by using the ColorAxis class. Gradient chart legend is a small bar of integrated colors obtained from the Colors definitions. Each color is for a specific numeric range and it integrates with the next color, creating a gradient legend. Every point on the gradient legend represents a distinctive color and value. Therefore, all the dissimilar values in the chart appear in distinctive colors as per the position on the gradient legend.
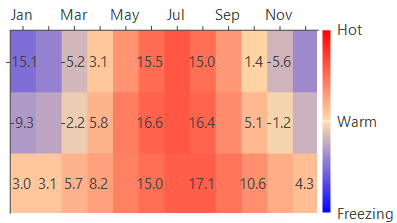
To implement heat map with a gradient legend, you need to provide an instance of ColorAxis class to the Axis property provided by the GradientColorScale class. Moreover, you also need to specify the Min, Max and Colors property to set up a gradient legend. You can also choose to label the gradient legend with defined categories instead of values by providing a data source for the color axis.
Gradient Legend with Values | Gradient Legend with Categories |
|---|---|
|
|
//Define gradient scale for HeatMap and its range
    var gradientScale = new GradientColorScale
   {
       Min = -30,
       Max = 30,
       Colors = new List<Color>
       {
          Color.Blue,
          Color.NavajoWhite,
          Color.Red,
       },
       Axis = new ColorAxis
      {
          Position = Position.Right,
    // Set the data source for color axis
    // required only when rendering categories along the legend
       //   DataSource = new List<object>()
       //   {
       //      new { Value = -30, Text = "Freezing" },
       //      new { Value = 0, Text = "Warm" },
       //      new { Value = 30, Text = "Hot" }
       //  }
       }
  };
//Hiding legends as the values change gradually in along the gradient axis
   this.flexChart1.Legend.Position = Position.None;
'Define gradient scale for HeatMap and its range
Dim gradientScale As GradientColorScale = New GradientColorScale() With {
.Min = -30,
.Max = 30,
.Colors = New List(Of Color)() From {
Color.Blue,
Color.NavajoWhite,
Color.Red
},
.Axis = New ColorAxis() With {
.Position = Position.Right
' .DataSource = New List(Of Object)() From {
' New With {.Value = -30, .Text = "Freezing"},
' New With {.Value = 0, .Text = "Warm"},
' New With {.Value = 30, .Text = "Hot"}
'}
}
}
'Hiding legends as the values change gradually in along the gradient axis
Me.flexChart1.Legend.Position = Position.None