
Gantt Chart
Gantt charts are the charts which demonstrate the project schedules and plans by plotting the project activities against time. With activities listed on Y-axis and time scale along the X-axis, these charts indicate the duration of each activity through length of horizontal bars positioned to start at the start time of an activity.As primary purpose of a Gantt chart is planning and scheduling, gantt charts are used for a range of projects and in various industries, such as construction, engineering, manufacturing, infrastructure, IT and more.
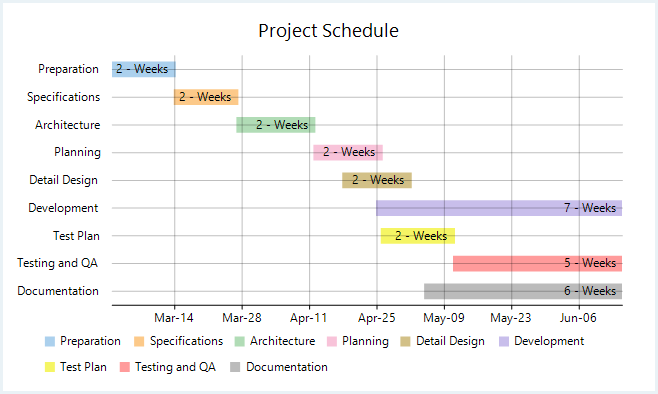
In FlexChart, WinForms gantt chart can be implemented using the Series class. To begin with, create a new Series object and specify its properties. Then, use the SymbolRendering event provided by the Series class to plot activity bars on the chart and the LabelRendering event provided by the FlexChart class to display the labels.
private void Form1_Load(object sender, EventArgs e)
{
    this.flexChart1.ChartType = ChartType.Bar;
    this.flexChart1.BindingX = "Name";
    Series series = new GanttSeriesWithPointLegendItems() { Binding = "End" };
    series.SymbolRendering += Series_SymbolRendering;
    this.flexChart1.Series.Add(series);
    this.flexChart1.DataLabel.Content = "{DurationInWeeks} - Weeks";
    this.flexChart1.DataLabel.Position = LabelPosition.Left;
    this.flexChart1.DataSource = taskData = GetTasksData();
    this.flexChart1.AxisX.Min = taskData[taskData.Count - 1].Start.ToOADate();
    this.flexChart1.AxisX.MajorGrid = true;
    this.flexChart1.AxisX.MajorUnit = 14D;
    this.flexChart1.AxisX.Format = "MMM-dd";
    this.flexChart1.Header.Content = "Project Schedule";
}
public class GanttSeriesWithPointLegendItems : Series, ISeries
{
    string ISeries.GetLegendItemName(int index) { return taskData.ElementAt(taskData.Count - 1 - index).Name; }
    _Style ISeries.GetLegendItemStyle(int index)
    {
        return new _Style { Fill = new SolidBrush(colors[(index) % colors.Length]) };
    }
    int ISeries.GetLegendItemLength() { return taskData.Count; }
}
private void Series_SymbolRendering(object sender, RenderSymbolEventArgs e)
{
    e.Cancel = true;
    Task task = (Task)e.Item;
    var height = this.flexChart1.PlotRect.Height / ((List<Task>)this.flexChart1.DataSource).Count / 2;
    var start = this.flexChart1.AxisX.Convert(task.Start.ToOADate());
    e.Engine.SetFill(new SolidBrush(colors[(taskData.Count - 1 - e.Index) % colors.Length]));
    e.Engine.SetStroke(new SolidBrush(colors[(taskData.Count - 1 - e.Index) % colors.Length]));
    e.Engine.DrawRect(start, e.Point.Y - height / 2, e.Point.X - start, height);
}
Private Sub Form1_Load(sender As Object, e As EventArgs)
Me.flexChart1.ChartType = ChartType.Bar
Me.flexChart1.BindingX = "Name"
Dim series As Series = New GanttSeriesWithPointLegendItems() With {
.Binding = "End"
}
AddHandler series.SymbolRendering, AddressOf Series_SymbolRendering
Me.flexChart1.Series.Add(series)
Me.flexChart1.DataLabel.Content = "{DurationInWeeks} - Weeks"
Me.flexChart1.DataLabel.Position = LabelPosition.Left
Me.flexChart1.DataSource = InlineAssignHelper(taskData, GetTasksData())
Me.flexChart1.AxisX.Min = taskData(taskData.Count - 1).Start.ToOADate()
Me.flexChart1.AxisX.MajorGrid = True
Me.flexChart1.AxisX.MajorUnit = 14.0
Me.flexChart1.AxisX.Format = "MMM-dd"
Me.flexChart1.Header.Content = "Project Schedule"
End Sub
Public Class GanttSeriesWithPointLegendItems
Inherits Series
Implements ISeries
Private Function ISeries_GetLegendItemName(index As Integer) As String Implements ISeries.GetLegendItemName
Return taskData.ElementAt(taskData.Count - 1 - index).Name
End Function
Private Function ISeries_GetLegendItemStyle(index As Integer) As _Style Implements ISeries.GetLegendItemStyle
Return New _Style() With {
.Fill = New SolidBrush(colors((index) Mod colors.Length))
}
End Function
Private Function ISeries_GetLegendItemLength() As Integer Implements ISeries.GetLegendItemLength
Return taskData.Count
End Function
End Class
Private Sub Series_SymbolRendering(sender As Object, e As RenderSymbolEventArgs)
e.Cancel = True
Dim task As Task = DirectCast(e.Item, Task)
Dim height As Single = Me.flexChart1.PlotRect.Height / DirectCast(Me.flexChart1.DataSource, List(Of Task)).Count / 2
Dim start As Double = Me.flexChart1.AxisX.Convert(task.Start.ToOADate())
e.Engine.SetFill(New SolidBrush(colors((taskData.Count - 1 - e.Index) Mod colors.Length)))
e.Engine.SetStroke(New SolidBrush(colors((taskData.Count - 1 - e.Index) Mod colors.Length)))
e.Engine.DrawRect(start, e.Point.Y - height / 2, e.Point.X - start, height)
End SubNote that the above sample code uses a custom method named GetTasksData to supply data to the chart. You can set up the data source as per your requirements.
public static List<Task> GetTasksData()
{
    var taskList = new List<Task>();
    var year = DateTime.Now.Year;
    taskList.Add(new Task { Name = "Documentation", Start = new DateTime(year, 5, 5), End = new DateTime(year, 6, 15) });
    taskList.Add(new Task { Name = "Testing and QA", Start = new DateTime(year, 5, 11), End = new DateTime(year, 6, 15) });
    taskList.Add(new Task { Name = "Test Plan", Start = new DateTime(year, 4, 26), End = new DateTime(year, 5, 11) });
    taskList.Add(new Task { Name = "Development", Start = new DateTime(year, 4, 25), End = new DateTime(year, 6, 15) });
    taskList.Add(new Task { Name = "Detail Design", Start = new DateTime(year, 4, 18), End = new DateTime(year, 5, 2) });
    taskList.Add(new Task { Name = "Planning", Start = new DateTime(year, 4, 12), End = new DateTime(year, 4, 26) });
    taskList.Add(new Task { Name = "Architecture", Start = new DateTime(year, 3, 27), End = new DateTime(year, 4, 12) });
    taskList.Add(new Task { Name = "Specifications", Start = new DateTime(year, 3, 14), End = new DateTime(year, 3, 27) });
    taskList.Add(new Task { Name = "Preparation", Start = new DateTime(year, 3, 1), End = new DateTime(year, 3, 14) });
    return taskList;
}
Public Shared Function GetTasksData() As List(Of Task)
Dim taskList As List(Of Task) = New List(Of Task)()
Dim year As Integer = DateTime.Now.Year
taskList.Add(New Task() With {
.Name = "Documentation",
.Start = New DateTime(year, 5, 5),
.[End] = New DateTime(year, 6, 15)
})
taskList.Add(New Task() With {
.Name = "Testing and QA",
.Start = New DateTime(year, 5, 11),
.[End] = New DateTime(year, 6, 15)
})
taskList.Add(New Task() With {
.Name = "Test Plan",
.Start = New DateTime(year, 4, 26),
.[End] = New DateTime(year, 5, 11)
})
taskList.Add(New Task() With {
.Name = "Development",
.Start = New DateTime(year, 4, 25),
.[End] = New DateTime(year, 6, 15)
})
taskList.Add(New Task() With {
.Name = "Detail Design",
.Start = New DateTime(year, 4, 18),
.[End] = New DateTime(year, 5, 2)
})
taskList.Add(New Task() With {
.Name = "Planning",
.Start = New DateTime(year, 4, 12),
.[End] = New DateTime(year, 4, 26)
})
taskList.Add(New Task() With {
.Name = "Architecture",
.Start = New DateTime(year, 3, 27),
.[End] = New DateTime(year, 4, 12)
})
taskList.Add(New Task() With {
.Name = "Specifications",
.Start = New DateTime(year, 3, 14),
.[End] = New DateTime(year, 3, 27)
})
taskList.Add(New Task() With {
.Name = "Preparation",
.Start = New DateTime(year, 3, 1),
.[End] = New DateTime(year, 3, 14)
})
Return taskList
End Function