Range Selector
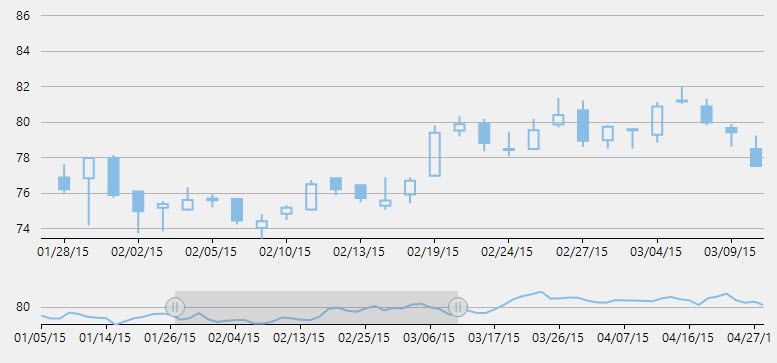
FinancialChart's RangeSelector lets a user select a specific range of data to be displayed on the chart. A user can easily bind the RangeSelector with various types of financial charts. It is mostly used by finance industry to perform stock analysis on different data ranges.
The RangeSelector has a left thumb (for minimum value) and right thumb (for maximum value) that lets you scroll through particular time periods on the chart. Users can change the minimum and maximum values of the RangeSelector, and adjust the visible range of data on the chart by dragging these thumbs to left or right. On dragging the thumb towards left on the range bar, you reduce its value, and dragging it towards the right increases its value on the range bar.
To work with RangeSelector, you first need to create a namespace C1.Win.Chart.RangeSelector containing a class RangeSelector in code. Then, to use RangeSelector, you need to create an instance of the RangeSelector class.
The following code snippet illustrates how to use RangeSelector in an application.
Public Class DataService
    Public Class DataService
        Private _companies As New List(Of Company)()
        Public Sub New()
            _companies.Add(New Company() With {
            .Symbol = "box",
            .Name = "Box Inc"
        })
            _companies.Add(New Company() With {
            .Symbol = "fb",
            .Name = "Facebook"
        })
        End Sub
        Public Function GetCompanies() As List(Of Company)
            Return _companies
        End Function
        Public Function GetSymbolData(symbol As String) As List(Of Quote)
            Dim path As String = String.Format("FinancialChartExplorer.Resources.{0}.json", symbol)
            Dim stream = Assembly.GetExecutingAssembly().GetManifestResourceStream(path)
            Dim ser = New System.Runtime.Serialization.Json.DataContractJsonSerializer(GetType(Quote()))
            Dim data = DirectCast(ser.ReadObject(stream), Quote())
            Return data.ToList()
        End Function
        Shared _ds As DataService
        Public Shared Function GetService() As DataService
            If _ds Is Nothing Then
                _ds = New DataService()
            End If
            Return _ds
        End Function
    End Class
    Public Class Quote
        Public Property [date](/componentone/docs/win/online-financialchart/Interaction/RangeSelector) As String
            Get
                Return m_date
            End Get
            Set
                m_date = Value
            End Set
        End Property
        Private m_date As String
        Public Property high() As Double
            Get
                Return m_high
            End Get
            Set
                m_high = Value
            End Set
        End Property
        Private m_high As Double
        Public Property low() As Double
            Get
                Return m_low
            End Get
            Set
                m_low = Value
            End Set
        End Property
        Private m_low As Double
        Public Property open() As Double
            Get
                Return m_open
            End Get
            Set
                m_open = Value
            End Set
        End Property
        Private m_open As Double
        Public Property close() As Double
            Get
                Return m_close
            End Get
            Set
                m_close = Value
            End Set
        End Property
        Private m_close As Double
        Public Property volume() As Double
            Get
                Return m_volume
            End Get
            Set
                m_volume = Value
            End Set
        End Property
        Private m_volume As Double
    End Class
    Public Class Company
        Public Property Symbol() As String
            Get
                Return m_Symbol
            End Get
            Set
                m_Symbol = Value
            End Set
        End Property
        Private m_Symbol As String
        Public Property Name() As String
            Get
                Return m_Name
            End Get
            Set
                m_Name = Value
            End Set
        End Property
        Private m_Name As String
    End Class
End Class
public class DataService
{
List<Company> _companies = new List<Company>();
public DataService()
{
_companies.Add(new Company() { Symbol = "box", Name = "Box Inc" });
_companies.Add(new Company() { Symbol = "fb", Name = "Facebook" });
}
public List<Company> GetCompanies()
{
return _companies;
}
public List<Quote> GetSymbolData(string symbol)
{
string path = string.Format("FinancialChartExplorer.Resources.{0}.json", symbol);
var stream = Assembly.GetExecutingAssembly().GetManifestResourceStream(path);
var ser = new System.Runtime.Serialization.Json.DataContractJsonSerializer(typeof(Quote[]));
var data = (Quote[])ser.ReadObject(stream);
return data.ToList();
}
static DataService _ds;
public static DataService GetService()
{
if (_ds == null)
_ds = new DataService();
return _ds;
}
}
public class Quote
{
public string date { get; set; }
public double high { get; set; }
public double low { get; set; }
public double open { get; set; }
public double close { get; set; }
public double volume { get; set; }
}
public class Company
{
public string Symbol { get; set; }
public string Name { get; set; }
}Partial Public Class RangeSelector
Inherits UserControl
Private rs As C1.Win.Chart.RangeSelector.RangeSelector
Public Sub New()
InitializeComponent()
Dim dataService__1 = DataService.GetService()
Dim data = dataService__1.GetSymbolData("fb")
financialChart1.BeginUpdate()
financialChart1.BindingX = "date"
financialChart1.Binding = "high,low,open,close,volume"
financialChart1.ToolTip.Content = "Date: {date}" & vbLf &
"Open: {open}" & vbLf &
"High: {high}" & vbLf &
"Low: {low}" & vbLf &
"Close: {close}"
financialChart1.Series.Add(New FinancialSeries())
financialChart1.ChartType = C1.Chart.Finance.FinancialChartType.Candlestick
financialChart1.DataSource = data
financialChart1.EndUpdate()
financialChart2.BeginUpdate()
financialChart2.BindingX = "date"
financialChart2.Binding = "close"
financialChart2.Series.Add(New FinancialSeries())
financialChart2.ChartType = C1.Chart.Finance.FinancialChartType.Line
financialChart2.DataSource = data
financialChart2.ToolTip.Content = Nothing
financialChart2.EndUpdate()
End Sub
Private Sub RangeSelector_Load(sender As Object, e As EventArgs)
AddHandler financialChart2.Rendered, AddressOf financialChart2_Rendered
End Sub
Private Sub financialChart2_Rendered(sender As Object, e As C1.Win.Chart.RenderEventArgs)
If rs Is Nothing AndAlso financialChart2.AxisX.ActualMin <> financialChart2.AxisX.ActualMax Then
rs = New C1.Win.Chart.RangeSelector.RangeSelector(financialChart2)
AddHandler rs.ValueChanged, AddressOf rs_ValueChanged
End If
End Sub
Private Sub rs_ValueChanged(sender As Object, e As EventArgs)
financialChart1.AxisX.Min = rs.LowerValue
financialChart1.AxisX.Max = rs.UpperValue
End Sub
End Classpublic partial class RangeSelector : UserControl
{
C1.Win.Chart.RangeSelector.RangeSelector rs;
public RangeSelector()
{
InitializeComponent();
var dataService = DataService.GetService();
var data = dataService.GetSymbolData("fb");
financialChart1.BeginUpdate();
financialChart1.BindingX = "date";
financialChart1.Binding = "high,low,open,close,volume";
financialChart1.ToolTip.Content = "Date: {date}\nOpen: {open}\nHigh: {high}\nLow: {low}\nClose: {close}";
financialChart1.Series.Add(new FinancialSeries());
financialChart1.ChartType = C1.Chart.Finance.FinancialChartType.Candlestick;
financialChart1.DataSource = data;
financialChart1.EndUpdate();
financialChart2.BeginUpdate();
financialChart2.BindingX = "date";
financialChart2.Binding = "close";
financialChart2.Series.Add(new FinancialSeries());
financialChart2.ChartType = C1.Chart.Finance.FinancialChartType.Line;
financialChart2.DataSource = data;
financialChart2.ToolTip.Content = null;
financialChart2.EndUpdate();
}
private void RangeSelector_Load(object sender, EventArgs e)
{
financialChart2.Rendered += financialChart2_Rendered;
}
void financialChart2_Rendered(object sender, C1.Win.Chart.RenderEventArgs e)
{
if (rs == null && financialChart2.AxisX.ActualMin != financialChart2.AxisX.ActualMax)
{
rs = new C1.Win.Chart.RangeSelector.RangeSelector(financialChart2);
rs.ValueChanged += rs_ValueChanged;
}
}
void rs_ValueChanged(object sender, EventArgs e)
{
financialChart1.AxisX.Min = rs.LowerValue;
financialChart1.AxisX.Max = rs.UpperValue;
}
}