
Creating Dashboard with Flow Layout
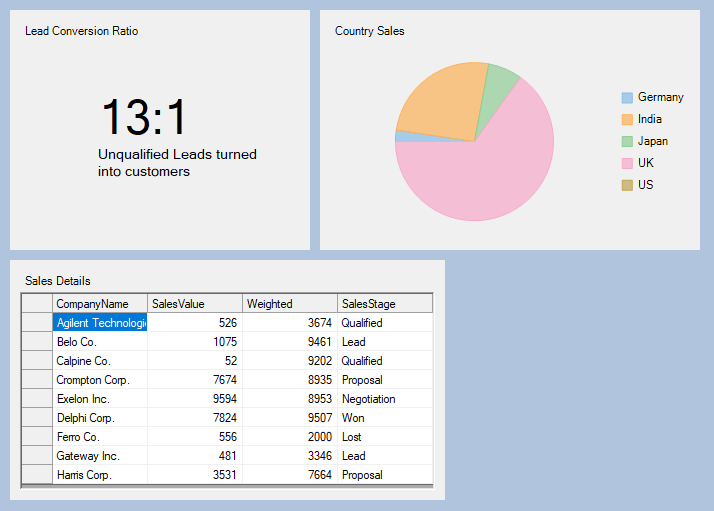
This topic guides you through the steps to create a lead conversion dashboard using flow layout. It displays the lead conversion ratio, sales in different countries in a pie chart, and sales details of companies in a FlexgGrid.
Create a new Windows Forms App.
In the Windows Forms Designer, set the height of the form to 730 and width to 550.
Drag and drop the C1DashboardLayout control from the Toolbox onto your form.
Observe: By default, a layout of the type Split is attached to it.
Select the C1DashboardLayout control. In the Properties window, set the following properties:
Property Name
Value
LayoutType
Flow
Dock
Fill
Styles > Common > Padding
5
Styles > ItemContainer > Margins
5
5. Click inside the C1DashboardLayout control. The FlowContentPanel (layout control attached to C1DashboardLayout) is selected.
Observe: By default, the FlowContentPanel contains two child containers named Panel1 and Panel3 of the type Panel. Panel1 positions itself at the upper left corner of the FlowContentPanel since its FlowDirection property is set to LeftToRight by default and Panel3 positions itself next to Panel1, maintaining the default LeftToRight flow direction as the width of C1DashboardLayout has not yet exhausted.
6. Select Panel1 and set the following properties.
Property | Value |
|---|---|
Size | 360, 240 |
Caption on c1DashboardLayout1 | Lead Conversion Ratio |
7. Drag and drop a Label control on Panel1 and set the following properties:
Property Name | Value |
|---|---|
Location | 80, 80 |
Text | 13:1 |
Font size | 35 |
Now, drag and drop another Label control on Panel1 and set the following properties:
Property Name | Value |
|---|---|
Location | 85, 135 |
Text | Unqualified Leads turned into customers |
Font > Size | 35 |
8. Select Panel3 and set the following properties:
Property Name | Value |
|---|---|
Size | 380,240 |
Caption on c1DashboardLayout1 | Country Sales |
9. Drag and drop a FlexPie on Panel3 and set the following properties:
Property Name | Value |
|---|---|
Dock | Fill |
BindingName | CountryName |
Binding | OpportunityCount |
10. Add a class named CountrySales.cs to the project and copy the following code to it to add data for FlexPie.
public class CountrySales
{
    public CountrySales(string countryName, int opportunityCount)
    {
        CountryName = countryName;
        OpportunityCount = opportunityCount;
    }
    public CountrySales() { }
    public string CountryName { get; set; }
    public int OpportunityCount { get; set; }
    public List<CountrySales> GetData()
    {
        string[] countryNames = {"Germany", "India", "Japan", "UK" , "US" };
        List<CountrySales> countrySalesList = new List<CountrySales>();
        Random random = new Random();
        for (int i = 0; i < 5; i++)
            countrySalesList.Add(new CountrySales(countryNames[i],random.Next(0,30)));
        return countrySalesList;
    }
}
Public Class CounTrySales
Public Sub New(ByVal counTryName As String, ByVal opportunityCount As Integer)
CounTryName = counTryName
OpportunityCount = opportunityCount
End Sub
Public Sub New()
End Sub
Public Property CounTryName() As String
End Property
Public Property OpportunityCount() As Integer
End Property
Public List< New> Sub GetData()
Dim counTryNames() As String = {"Germany", "India", "Japan", "UK" , "US"}
Dim counTrySalesList As List<CounTrySales> = New List<CounTrySales>()
Dim random As Random = New Random()
Dim i As Integer
For i = 0 To 5- 1 Step i + 1
counTrySalesList.Add(New CounTrySales(counTryNames(i),random.Next(0,30)))
Next
Return counTrySalesList
End Sub
End ClassAdd the following code to the Form1_Load event to populate the pie with data.
CountrySales countrySales = new CountrySales();
List<CountrySales> countrySalesList = countrySales.GetData();
flexPie1.DataSource = countrySalesList;
Dim counTrySales As CounTrySales = New CounTrySales()
Dim counTrySalesList As List<CounTrySales> = counTrySales.GetData()
flexPie1.DataSource = counTrySalesListDrag and drop the C1FlexGrid control on the DashboardLayout and set its Dock property to Fill.
Observe: A child container named Panel5 is created under the C1FlexGrid control. As the WrapContents property of FlowContentPanel is set to true and the width of C1DashboardLayout has exhausted, the child container containing the FlexGrid is wrapped to the next row which would have been clipped otherwise.
Select Panel5 and set the following properties.
Property Name | Value |
|---|---|
Size | 435,240 |
Caption on c1DashboardLayout1 | Sales Details |
Add a class named SalesDetails.cs to the project and copy the following code to it to add data for FlexGrid.
public class SalesDetails
{
    public SalesDetails(string companyName, double salesValue, double weighted,string salesStage)
    {
        CompanyName = companyName;
        SalesValue = salesValue;
        Weighted = weighted;
        SalesStage = salesStage;
    }
    public SalesDetails() { }
    public string CompanyName { get; set; }
    public double SalesValue { get; set; }
    public double Weighted { get; set; }
    public string SalesStage { get; set; }
    public List<SalesDetails> GetData()
    {
        string[] companyNames = { "Agilent Technologies", "Belo Co.", "Calpine Co.", "Crompton Corp.", "Exelon Inc.", "Delphi Corp.", "Ferro Co.","Gateway Inc.","Harris Corp."};
        string[] salesStages={"Qualified", "Lead", "Qualified", "Proposal", "Negotiation", "Won", "Lost","Lead","Proposal"};
        List<SalesDetails> salesDetailsList = new List<SalesDetails>();
        Random random = new Random();
        for(int i=0;i<9;i++)
        {
            salesDetailsList.Add(new SalesDetails(companyNames[i],random.Next(0,10000), random.Next(1,10000),salesStages[i]));
        }
        return salesDetailsList;
    }
}
Public Class SalesDetails
Public Sub New(ByVal companyName As String, ByVal salesValue As Double, ByVal weighted As Double, ByVal salesStage As String)
CompanyName = companyName
SalesValue = salesValue
Weighted = weighted
SalesStage = salesStage
End Sub
Public Sub New()
End Sub
Public Property CompanyName() As String
End Property
Public Property SalesValue() As Double
End Property
Public Property Weighted() As Double
End Property
Public Property SalesStage() As String
End Property
Public List<New> Sub GetData()
Dim companyNames() As String = {"Agilent Technologies", "Belo Co.", "Calpine Co.", "Crompton Corp.", "Exelon Inc.", "Delphi Corp.", "Ferro Co.","Gateway Inc.","Harris Corp."}
Dim salesStages() As String = {"Qualified", "Lead", "Qualified", "Proposal", "Negotiation", "Won", "Lost","Lead","Proposal"}
Dim salesDetailsList As List<SalesDetails> = New List<SalesDetails>()
Dim random As Random = New Random()
Dim i As Integer
For i = 0 To 9- 1 Step i + 1
salesDetailsList.Add(New SalesDetails(companyNames(i),random.Next(0,10000),random.Next(1,10000),salesStages(i)))
Next
Return salesDetailsList
End Sub
End ClassAdd the following code to Form1_Load event to populate the grid with data.
SalesDetails salesDetails = new SalesDetails();
List<SalesDetails> salesDetailsList = salesDetails.GetData();
c1FlexGrid1.DataSource = salesDetailsList;
Dim salesDetails As SalesDetails = New SalesDetails()
Dim salesDetailsList As List<SalesDetails> = salesDetails.GetData()
c1FlexGrid1.DataSource = salesDetailsListSelect C1DasboardLayout and in the Properties window, navigate to C1DashboardLayout > Styles > Common > BackColor property and set it to LightSteelBlue.
Note: If the BackColor property of C1DashboardLayout is set before adding child containers to it, the child containers inherit back color of the parent container. Therefore, changing the back color of C1DashboardLayout after adding child containers does not affect the child containers back color.
The sales conversion dashboard gets created.