
- 3D Chart for WinForms Overview
- Key Features
- 3D Chart Design-Time Support
- 3D Chart Fundamentals
- 3D Axes
- Design-Time Tools for Creating 3D Charts
- 3D Data
- 3D Labels
- 3D Chart Elements
- 3D Contour Styles
- 3D Chart End-User Interaction
- Chart 3D for WinForms Samples
- Chart 3D for WinForms Task-Based Help
- Chart 3D for WinForms Frequently Asked Questions
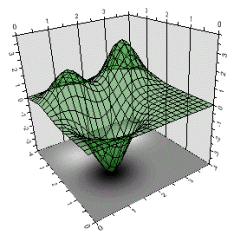
Creating Transparency for the Meshed and Shaded Charts
Use the Transparency property to set transparency of data drawing. Valid values of Transparency are 0 through 255. 0 - transparent, 255 - opaque.
type=note
Note: The transparency is not applied to Zoned and Contour charts.