
- 3D Chart for WinForms Overview
- Key Features
- 3D Chart Design-Time Support
- 3D Chart Fundamentals
- 3D Axes
- Design-Time Tools for Creating 3D Charts
- 3D Data
- 3D Labels
- 3D Chart Elements
- 3D Contour Styles
- 3D Chart End-User Interaction
- Chart 3D for WinForms Samples
- Chart 3D for WinForms Task-Based Help
- Chart 3D for WinForms Frequently Asked Questions
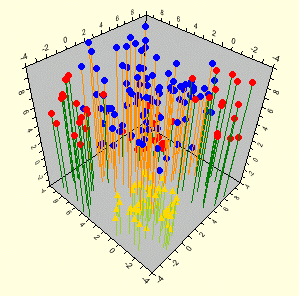
3D Scatter Plot Charts
The 3D Scatter plots consist of one or more series of individual points. They show a relationship between three or more variables which represent the X, Y, and one or more Z coordinates of each point. To create a better display of the 3D Scatter plot, you can add drop lines between the plotted points and the origin like shown in the following image:
Chart3DTypeEnum.Scatter
To set the 3D chart type to Scatter at design time:
- Expand the ChartGroups node in the Properties window, then expand Group0.
- Locate the ChartType property and select Scatter.
To programmatically set the 3D chart type to Scatter:
To write code in Visual Basic
C1Chart3D1.ChartGroups(0).ChartType = Chart3DTypeEnum.Scatter
To write code in C#
C1Chart3D1.ChartGroups[0].ChartType = Chart3DTypeEnum.Scatter;