
Conditional Formatting
This topic uses "Conditional Formatting" report to demonstrate how to change a field's appearance depending on the data it represents. This can be done using parameters.
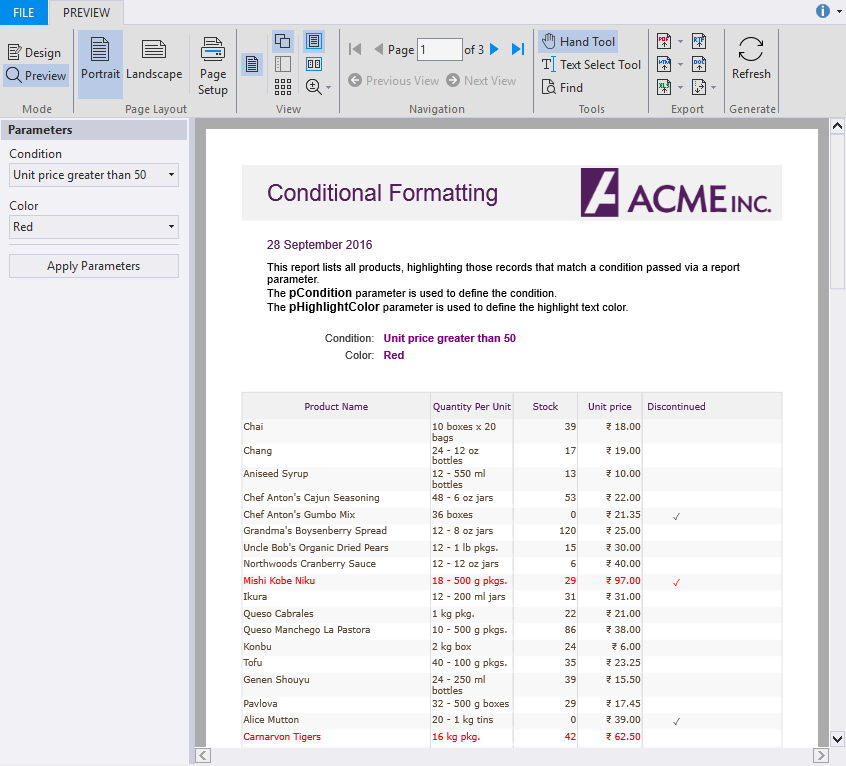
Conditional formatting allows you to format data based on one or more conditions. In this report, the data fields are highlighted depending on the following conditions which are defined in a parameter named pCondition:
- Unit price greater than 50
- Unit price greater than 100
- More than 50 units in stock
The report contains another parameter, pHighlightColor, that highlights the data fields depending on the conditions defined in the pCondition parameter.
On previewing the report, the data fields with the unit price greater than 50 are highlighted in red color. However, you can select any other condition from the above listed conditions and also change the highlighting color to green from the Parameters Panel.
Perform the following steps to create a report with conditional formatting..
Create a report
- Open the C1FlexReportDesigner and go to FILE|New.
- Click New Report drop down from the Reports tab and select Empty Report to create a report.
Connect the report to a data source
- Switch to the Data tab, right-click the Main data source and choose Edit to open and the Data Sources Wizard and start editing.
- Select OLEDB Data Provider from the Data provider drop-down and click the ellipsis button next to the Connection string textbox to select the C1NWind.mdb file.
- Select Products table from the Data source tab.
Add parameters
Right-click Parameters and select Add Parameters to add two parameters, pCondition and pHighlightColor.
Set the following properties for the parameters from the Properties window.
pCondition properties Value Prompt Condition Value 1 DataType Integer
pHighlightColor properties Value Prompt Color Value Red DataType String
Specify the properties for each parameters in AllowedValuesDefinition property as follows. The following values set alternate color to the row.
pCondition Labels Values Unit price greater than 50 CInt(1) Unit price greater than 100 CInt(2) More than 50 units in stock CInt(3)
pHighlightColor Labels Values Red Red Green Green
Add conditional formatting
Add four TextFields to the report header and set the following properties:
Property Value TextField1.Text =pCondition.Prompt & ":" TextField2.Text =pHighlightColor.Prompt & ":" TextField3.Text =pCondition.DisplayText TextField4.Text =pHighlightColor.DisplayText
Click Groups in Home tab and add a group named HeaderGroup.
In the Groups wizard, set the following properties for HeaderGroup:
Property Value ShowGroupFooter True ShowGroupHeader True
Click OK to close the Groups wizard.
In HeaderGroup_Header, add five TextFields and set the following properties.
Property Value TextField5.Text Product Name TextField6.Text Quantity Per Unit TextField7.Text Stock TextField8.Text Unit Price TextField9.Text Discontinued
In the Details section, add five TextFields corresponding to the TextFields in HeaderGroup_Header, and set the following properties:
Property Value TextField10.Text =ProductName TextField11.Text =QuantityPerUnit TextField12.Text =Stock TextField13.Text =UnitPrice TextField14.Text =Discontinued
Select Detail from the drop-down list on the top of the Properties window.
Go to the OnFormat property and click the ellipsis next to it.
The VBScript Editor appears. Enter the following VBScript expression in the editor to apply conditional formatting.
row = row + 1
if row mod 2 = 1 Then
  rowColor = Rgb(248, 248, 248)
Else
  rowColor = "Transparent"
EndIf

doHighlight = False
if pCondition = 1 Then
  doHighlight = UnitPrice > 50
ElseIf pCondition = 2 Then
  doHighlight = UnitPrice > 100
ElseIf pCondition = 3 Then
  doHighlight = UnitsInStock > 50
EndIf

if doHighlight Then
  textColor = pHighlightColor
Else
  textColor = Rgb(90, 70, 50)
EndIf

Detail.BackColor = rowColor
for i = 0 to Detail.Fields.Count - 1
  Detail.Fields(i).ForeColor = textColor
Next
View the report
- Preview the report.
- In the Preview mode, click Parameters from the View group to open the parameters panel and apply parameters.
type=note
Note: For the complete report, see report 'Conditional Formatting' in the FlexCommonTasks.flxr report definition file, which is available in the Documents\ComponentOne Samples\WinForms\vx.0\FlexReport\CS\FlexReportViewer\Reports folder. The data base used is C1NWind.mdb which is also available in the same folder.