
- Getting Started
- Configuring your MVC Application
- Adding NuGet Packages to your App
- Adding Controls
- Client-Side Support
- Working with Controls
- Globalization
- Styling
- ASP.NET MVC Samples
- Release History
Quick Start
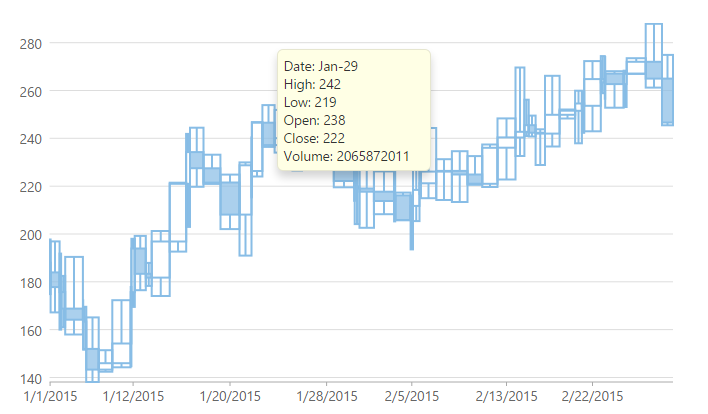
The quick start guides you through the steps of adding the FinancialChart control to your ASP.NET Core MVC web application, and add data to it.
Follow these steps to get started:
type=note
Note: The ComponentOne template for ASP.NET MVC Edition automatically registers the required resources, and adds the relevant references and packages to your application. Therefore, you need not follow the Steps 1 to 3 above if your application is created using ComponentOne template.
License your application
In the Solution Explorer, double-click the project name (for example, MVCFinancialChart) and expand node Properties.
Double-click the licenses.licx file to open it.2. In the licenses.licx file, add the following:
C1.Web.Mvc.LicenseDetector, C1.Web.Mvc
C1.Web.Mvc.Finance.LicenseDetector, C1.Web.Mvc.Finance
For more information on how to add license to your application, refer to Licensing.
Add the relevant references to your application
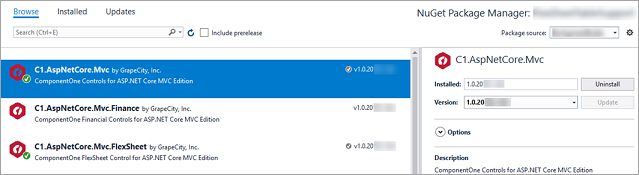
- Add the ASP.NET MVC Edition references to the project. In the Solution Explorer, right click References and select Manage NuGet Packages. In NuGet Package Manager, select https://api.nuget.org/v3/index.json as the Package source. Search for C1.AspNetCore.Mvc package, and click Install.
type=note
Note:
"C1.AspNetCore.Mvc"gets added under the "dependencies" within project.json file of your project once you restore the packages. - To work with Financial Chart control in your application, add C1.AspNetCore.Mvc.Finance package. Once you restore the packages, "C1.AspNetCore.Mvc.Finance" gets added under the "dependencies" in project.json file.
Configure the application to use FinancialChart
From the Solution Explorer, expand the folder Views and double click the _ViewImports.cshtml file to open it.
Add the following references to work with Financial Chart control in your ASP.NET Core application,
@addTagHelper *, C1.AspNetCore.Mvc
@addTagHelper *, C1.AspNetCore.Mvc.Finance
Register Resources
Complete the following steps to register the required resources for using ASP.NET MVC FinancialChart control:
From the Solution Explorer, open the folders Views | Shared.
Double click
_Layout.cshtmlto open it.Add the following code between the
<head></head>tags.<c1-styles/> <c1-scripts> <c1-finance-scripts /> </c1-scripts>
For more information on how to register resources for FinancialChart, refer to Registering Resources.
Create a Datasource for FinancialChart
Add a new class to the folder Models (for example:
FinanceData.cs). See Adding controls to know how to add a new model.Add the following code to the new model to define the classes that serve as a datasource for the FinancialChart control.
using System;
using System.Collections.Generic;
using System.Linq;
using System.Text;
using System.Threading.Tasks;
namespace MVCFinancialChart.Models
{
    public class FinanceData
    {
        public DateTime X { get; set; }
        public double High { get; set; }
        public double Low { get; set; }
        public double Open { get; set; }
        public double Close { get; set; }
        public double Volume { get; set; }
    }
}
Add a FinancialChart control
Complete the following steps to initialize a FinancialChart control.
Add a new Controller
In the Solution Explorer, right click the folder Controllers.
From the context menu, select Add | Controller. The Add Scaffold dialog appears.
Complete the following steps in the Add Scaffold dialog:
- Select Empty MVC Controller template.
- Set name of the controller (for example:
Default1Controller). - Click Add.
Include the MVC references as shown below.
using C1.Web.Mvc;
using C1.Web.Mvc.Serializition;
Replace the method
Index()with the following method.public ActionResult Index() { var model = GenerateFinanceData(); return View(model); } private List<FinanceData> GenerateFinanceData(int count = 60) { List<FinanceData> financeDatas = new List<FinanceData>() { }; DateTime startTime = new DateTime(2015, 1, 1); var rand = new Random(); double high, low, open, close, volume; for (int i = 0; i < count; i++) { DateTime dt = startTime.AddDays(i); if (i > 0) open = financeDatas[i - 1].Close; else open = 188; high = open + rand.NextDouble() * 30; low = open - rand.NextDouble() * 20; close = low + rand.NextDouble() * (high - low); volume = rand.Next(); financeDatas.Add(new FinanceData { X = dt, High = high, Low = low, Open = open, Close = close, Volume = volume }); } return financeDatas; }
Add a View for the Controller
Within the Controller, which was added in the above step, place the cursor inside the method
Index().Right click and select Add View. The Add View dialog appears.
In the Add View dialog, verify that the view name is Index and View engine is Razor (CSHTML).
Click Add. A view is added for the controller.
Instantiate a FinancialChart control in the view QuickStart as shown below.
@using C1.Web.Mvc.Chart;
<script type="text/javascript">
var tooltipContent = function (ht) {
var item = ht.series.collectionView.items[ht.pointIndex];
return 'Date: ' + wijmo.Globalize.format(ht.x, 'MMM-dd') + '<br/>' +
                    'High: ' + item.High.toFixed() + '<br/>' +
                    'Low: ' + item.Low.toFixed() + '<br/>' +
                    'Open: ' + item.Open.toFixed() + '<br/>' +
                    'Close: ' + item.Close.toFixed();
};
</script>
<c1-financial-chart binding-x="X" chart-type="C1.Web.Mvc.chart.Finance.ChartType.HighLowOpenClose">
<c1-items-source source-collection="Model"></c1-items-source>
<c1-financial-chart-series binding="High,Low,Open,Close"></c1-financial-chart-series>
<c1-flex-chart-tooltip content="tooltipContent"></c1-flex-chart-tooltip>
</c1-financial-chart>
Build and Run the Project
- Click Build | Build Solution to build the project.
- Press F5 to run the project.
type=note
Append the folder name and view name to the generated URL (for example: http://localhost:1234/QuickStart/Index) in the address bar of the browser to see the view.