Get Started With Drill Down Reports
Introduction
A drill-down report enables switching from a comprehensive data view down to a more detailed one. It assumes a hierarchical structure of the data visualization. Thus, a report reader can expand a parent item in the hierarchy so that its child items appear. In ActiveReportsJS you can build such a report using Table or Tablix data regions.
In this tutorial, we build the Category Sales report from the ground up, providing experience with the typical report designing process. By the end, you will be able to do the following:
Create a new report
Bind the report to the GraphQL API
Create a table data region
Group the data within the table to create a hierarchical data visualization
Display summary fields for multiple levels of the data hierarchy
Setup drill-down navigation for the data hierarchy
Use the
Galley modeof the report viewer
Upon completion of all tutorial steps, the final report will look like this: live demo.
Prerequisites
The following content assumes that you have the Standalone Report Designer running. Visit the tutorial for detailed information. A stable internet connection is also required to access the Demo Data Hub.
Creating a New Report
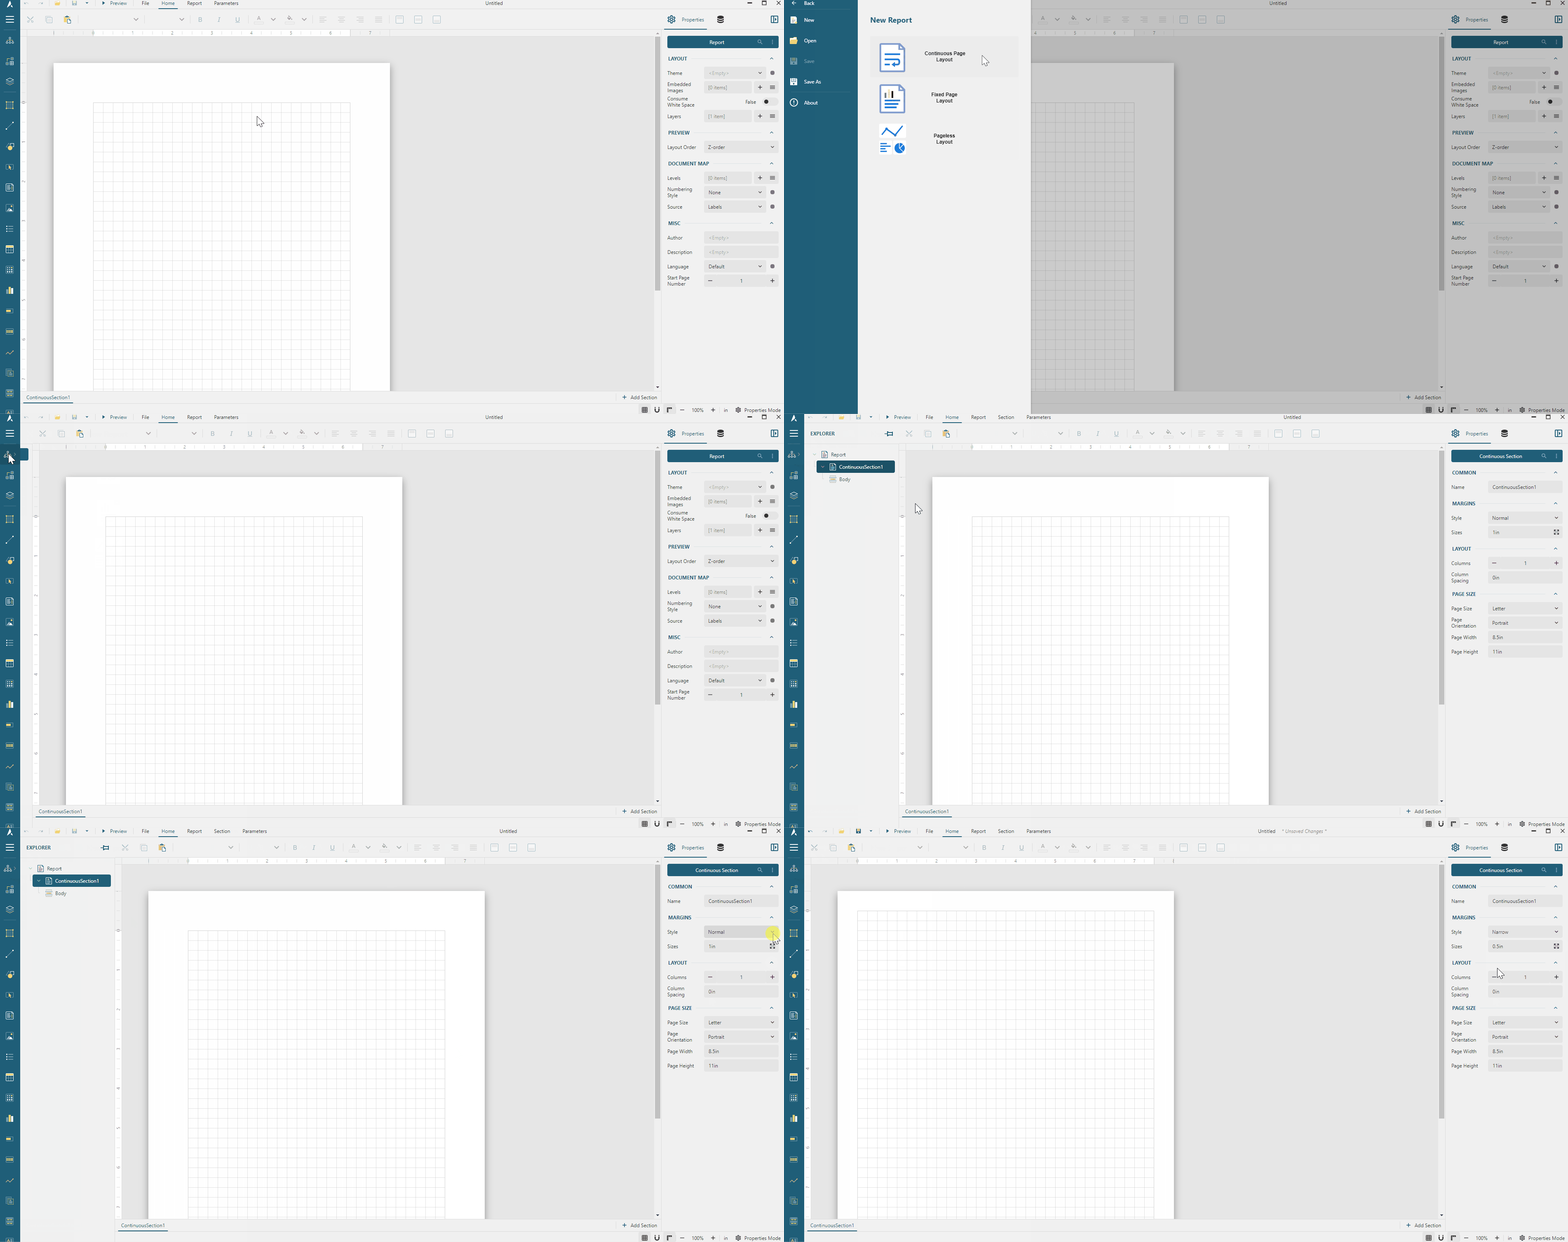
In the standalone report designer, click the File menu and select the Continuous Page Layout template for a newly created report. Click anywhere on the gray area around the report layout to load the report properties in the Properties panel. In the Margins section, set the Style property to Narrow to change the report page margins size.
Expand to watch creating a new report in action
Data Binding
Data binding establishes a connection between a report and the data it displays. This tutorial uses the MESCIUS Demo Data GraphQL API, which replicates the well-known Northwind database. It contains the sales data for a fictitious company called Northwind Traders, which imports and exports specialty foods worldwide.
Adding Data Source
You can think of the MESCIUS Demo GraphQL API as the "database" that you can connect to using its root URL https://demodata.mescius.io/northwind/graphql, and that accepts GraphQL queries and responds with the JSON data. You can create a Report DataSource that establishes such a "database connection" using the following steps.
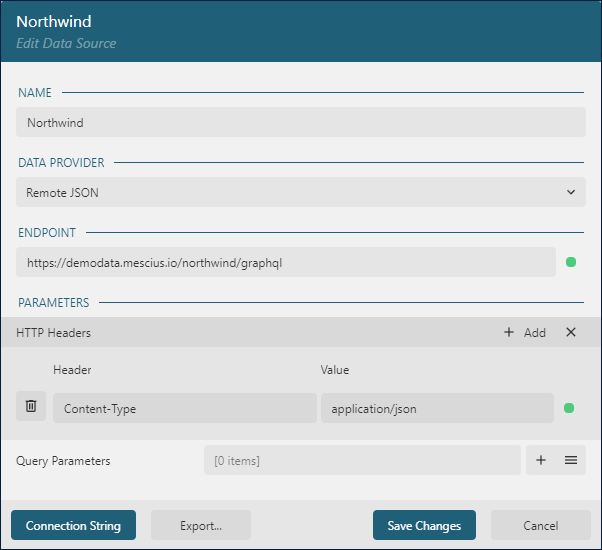
Open the Data panel of the property inspector and click the
AddbuttonIn the Data Source editor dialog, type
Northwindin the NAME field andhttps://demodata.mescius.io/northwind/graphqlin the ENDPOINT fieldClick the
+icon on the right side of theHTTP HeaderssectionType
Content-Typein theHeaderfield of the newly addedHeaderitemType
application/jsonin theValuefield of the sameHeaderitemClick the
Save Changesbutton
Adding Data Set
A GraphQL Data Set represents the query to the Data Source. For the Category Sales report, we need a single "Sales" query to select order details, including the product and its category information. GraphQL UI displays the prettified version of such a query:
{
  orderdetails {
    product {
      productId
      productName
      category {
        categoryId
        categoryName
      }
    }
    quantity
    unitPrice
    discount
  }
}
Use the following steps to add the Sales data set:
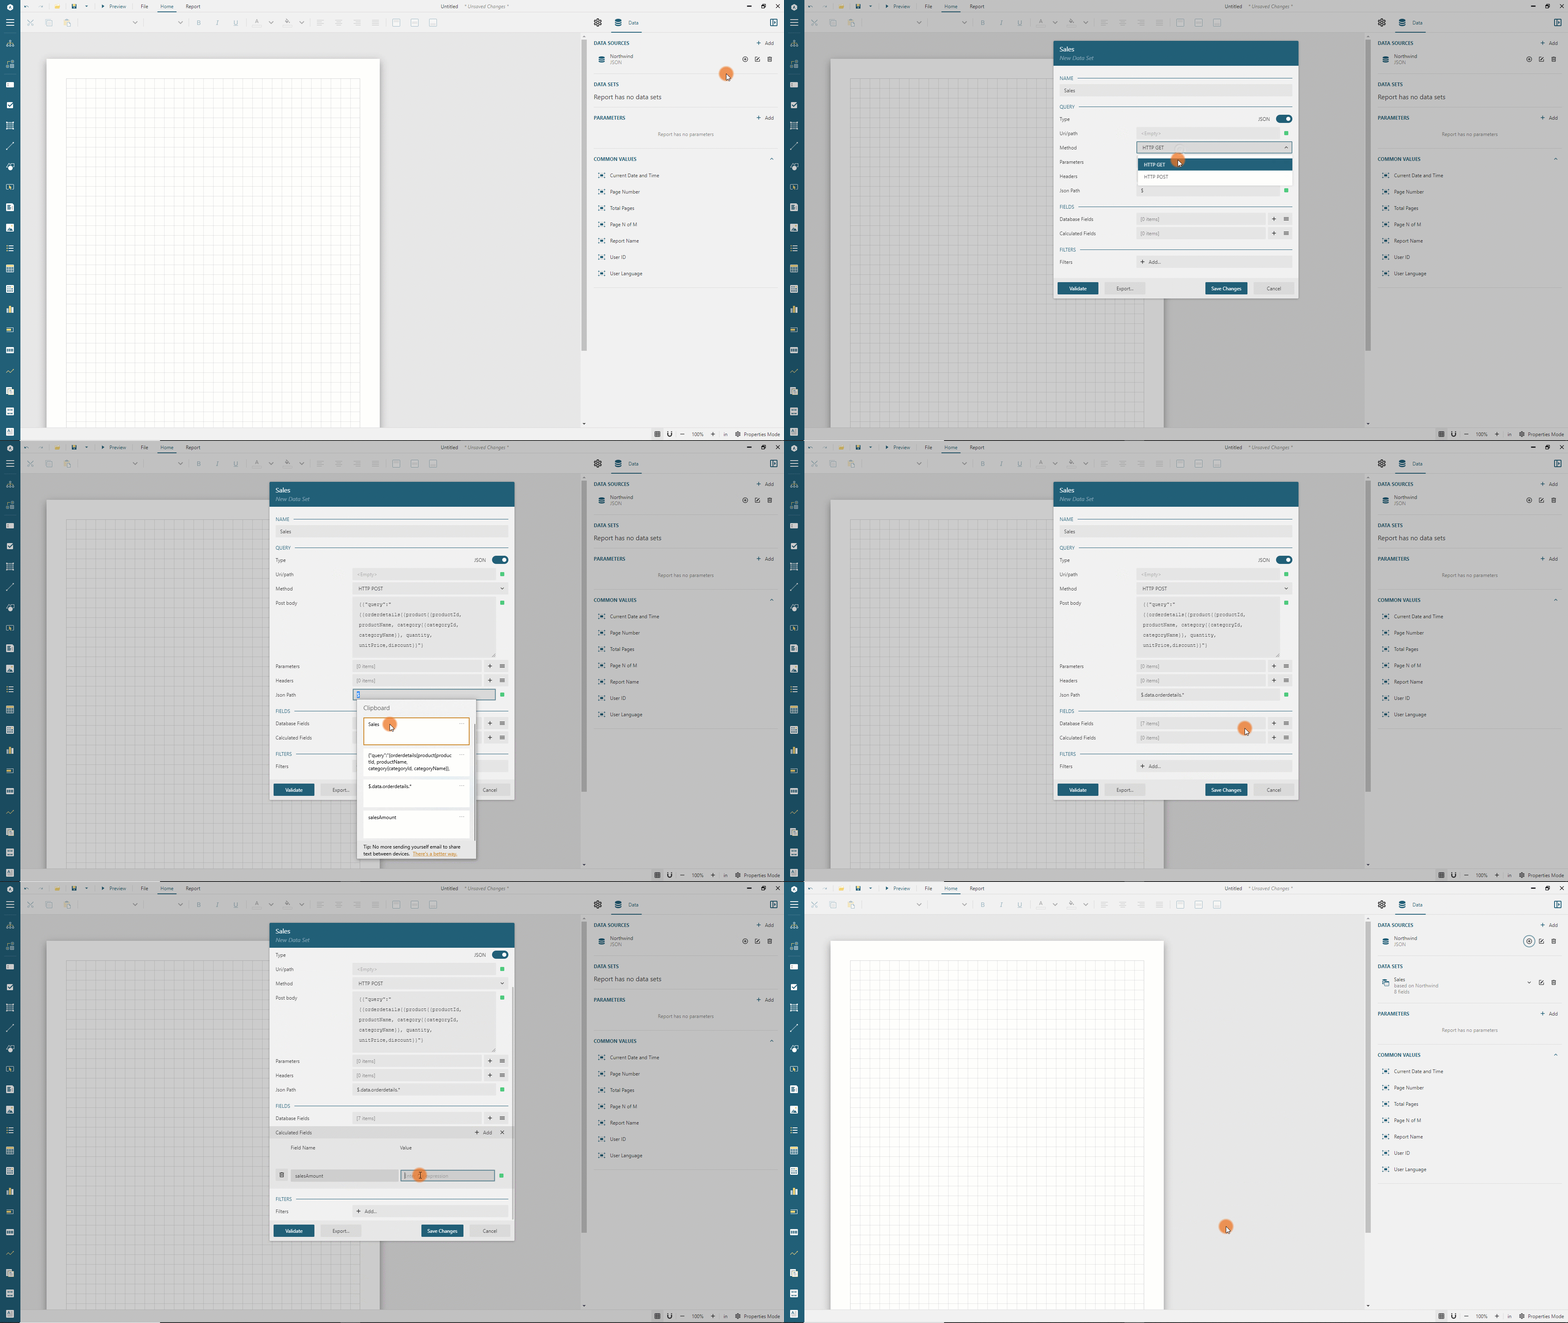
Click the
+icon nearNorthwindin the Data panelIn the Data Set Editor dialog, type
Salesin the NAME fieldSelect the
HTTP POSTin theMethoddrop-downType
{"query":"{orderdetails{product{productId, productName, category{categoryId, categoryName}}, quantity, unitPrice,discount}}"}in thePost bodyType
$.data.orderdetails.*in theJson PathfieldClick the
ValidatebuttonEnsure that the
DataBase Fieldssection displays[7 items]textClick the
+icon on the right side of theCalculated FieldssectionType
salesAmountin theField Namefield of the newly added itemType
{quantity * unitPrice * (1-discount)}in theValuefield of the same itemClick the
Save Changesbutton
Expand to watch adding the Sales data set in action
Adding Table Data Region
In this tutorial we use the Table Data Region to create the drill down report. There are several ways to add a new table into the report. We will use the regular way and adjust the default table configuration by adding a new column and removing the detail row.
Expand the toolbox using the
Hamburgermenu located on the left side of the toolbarDrag and drop the
Tableitem from the toolbox to the top-left corner of the report page areaClick anywhere inside the table so that it displays the columns and rows handlers
Right-click the last column handler and select the
Column > Insert Column Rightitem in the context menuRight-click the second row handler and select the
Deleteitem in the context menu
Expand to watch adding the Table Data Region in action
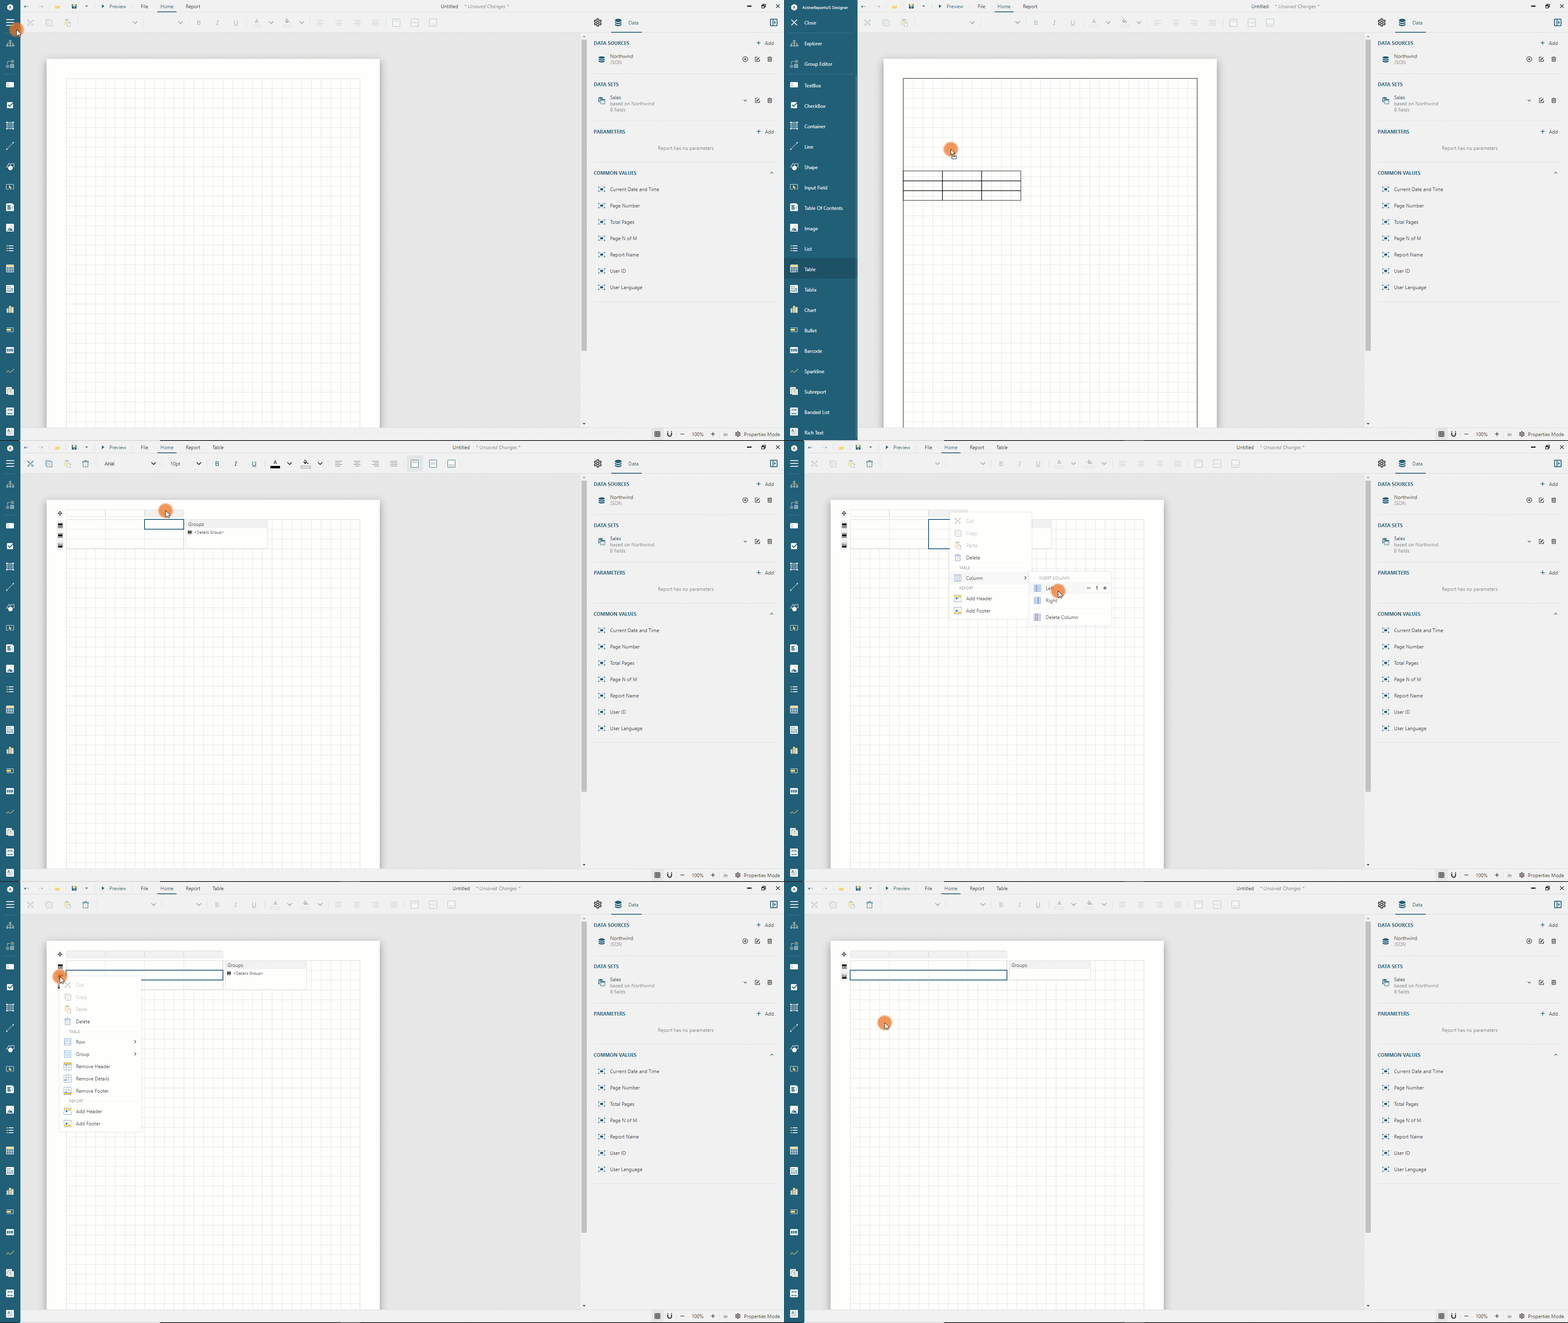
The newly created table has four columns, the header and the footer rows.
Setup Hierarchical Table Grouping
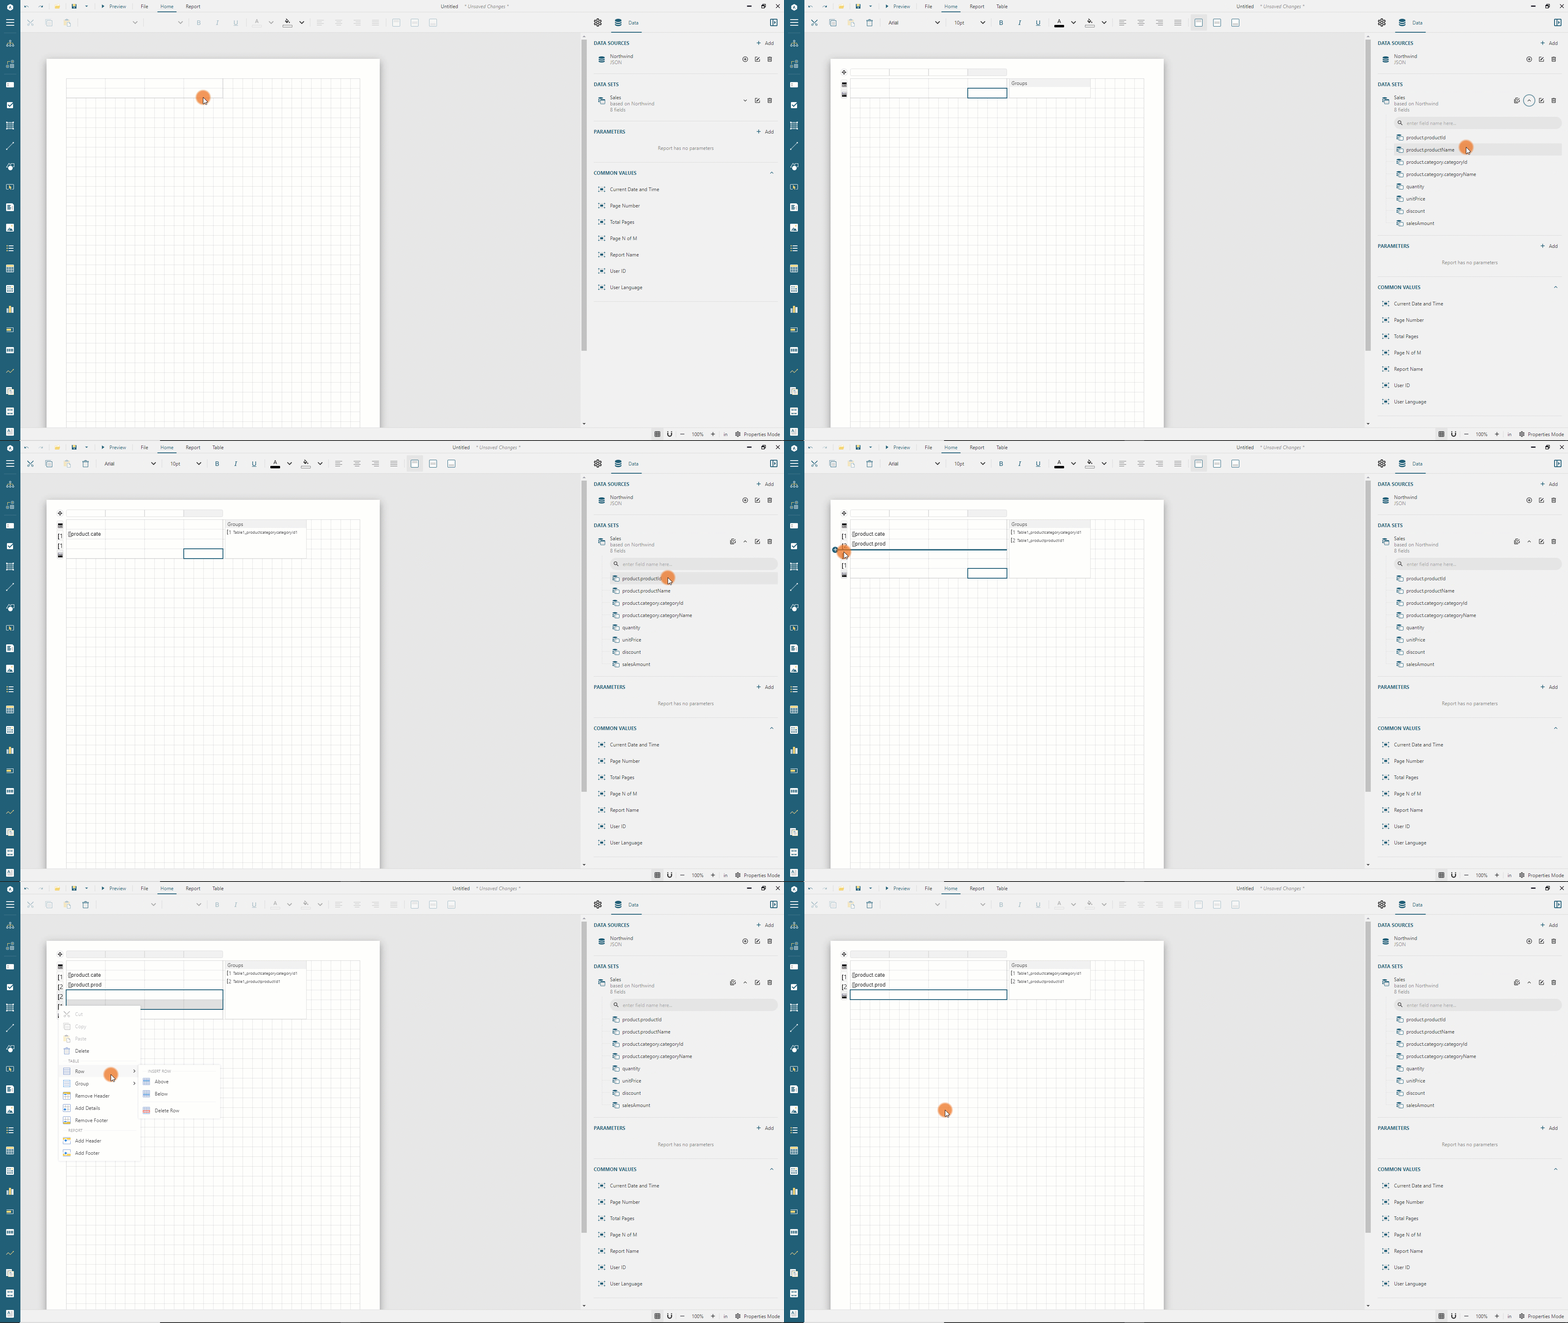
The report that we are building should display the sales total per product category on the topmost data hierarchy level. A report reader should expand this topmost level to display the sales total per product within the given category. To achieve that we group the table by the product.category.categoryId and then by product.productId fields of the Sales data set.
Click anywhere inside the table so that it displays the group editor
Expand the "Sales" data set in the Data panel using the chevron-down icon
Drag and drop the
product.category.categoryIdfield in the group editorDrag and drop the
product.productIdfields in the group editor
The table now has the header and footer rows for each group. We don't use group footers for the report; therefore, we can remove them:
Press the
Ctrlbutton on Windows orCmdon Mac OS and click the 4th and the 5th row handler of the tableRight-click the 4th or 5th row handler and select the
Row > Delete Rowitem in the context menu
Expand to watch grouping Table Data Region in action
Formatting Table Columns
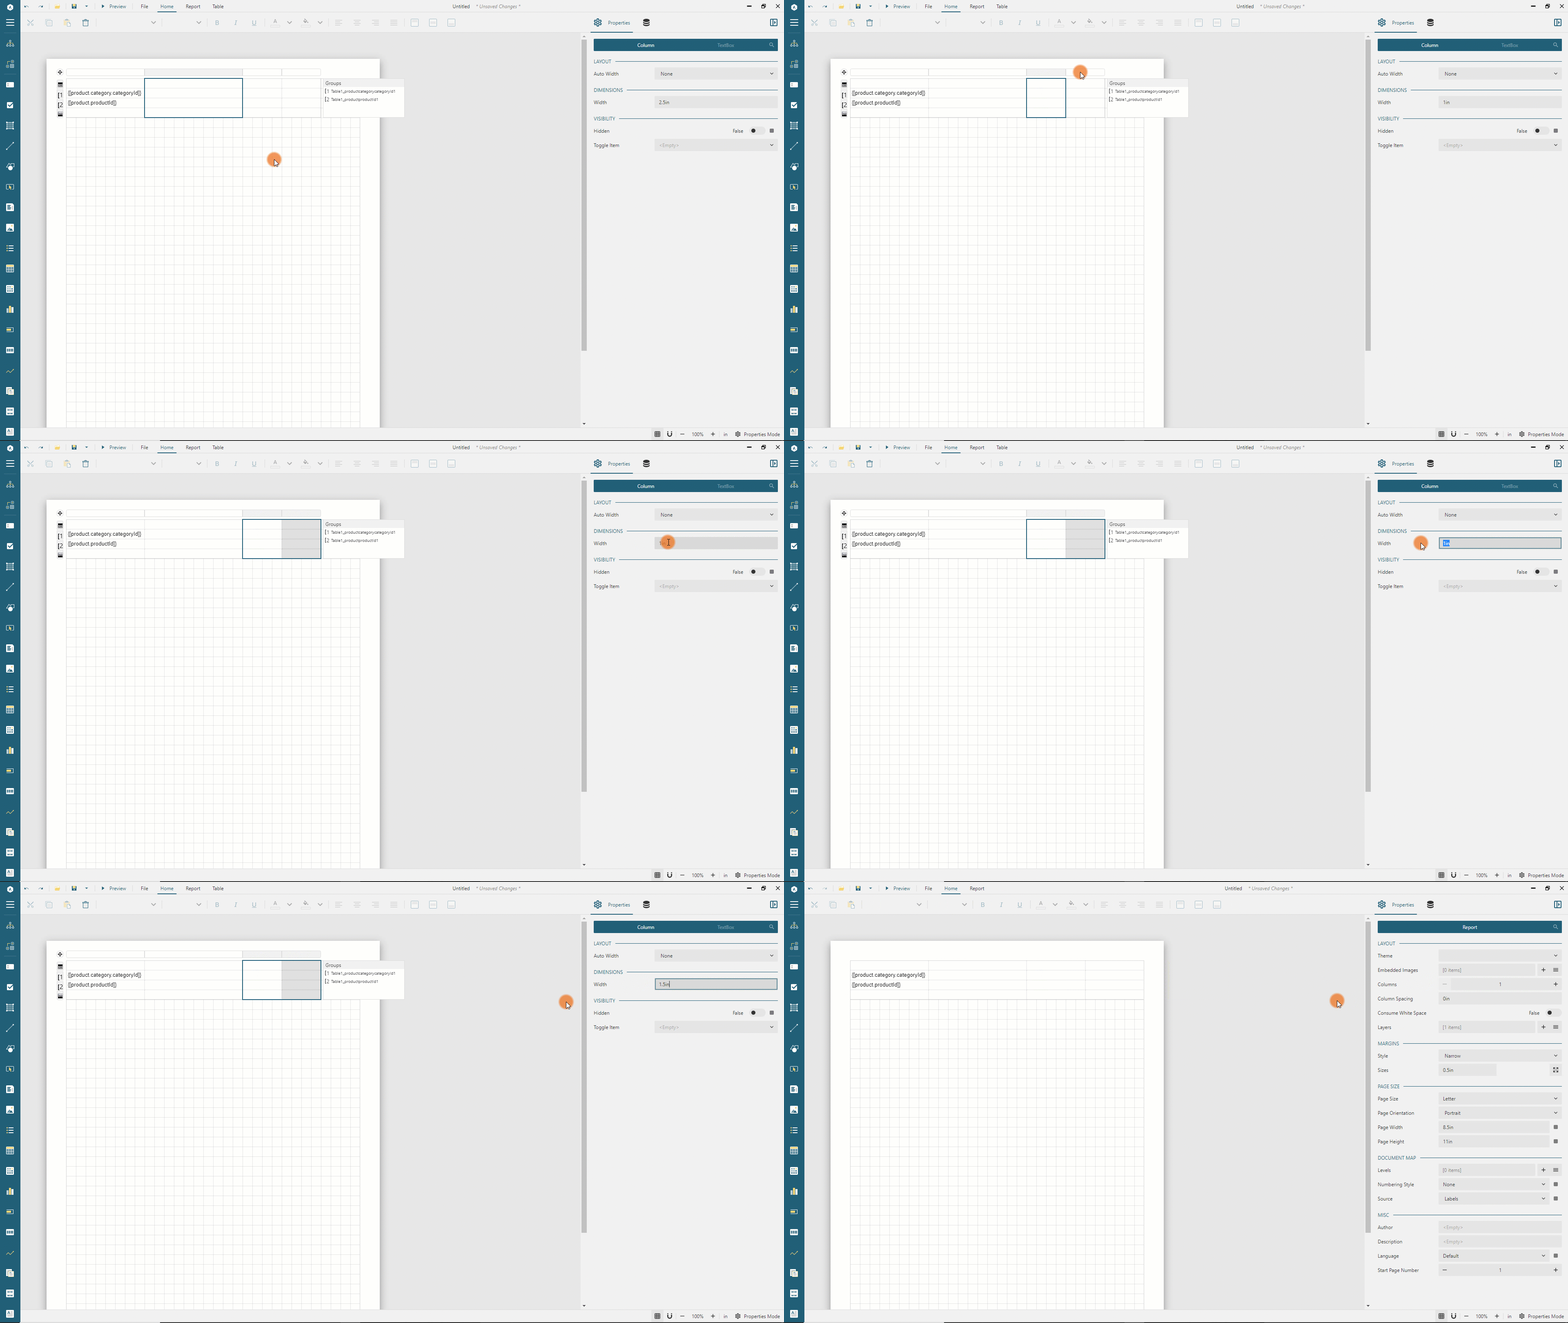
The table we are building should display the Product Category Name in the first column, the Product Name in the second column, and the totals for quantity and sales amount in the third and 4th columns. Based on this information, let's set up columns properties:
Click anywhere inside the table to display the columns and rows handlers
Click the first column handler and set its
Widthto2inin the Property inspectorClick the second column handler and set its
Widthto2.5inin the Property inspectorClick the 3rd column handler, press the
Ctrlbutton on Windows orCmdon Mac OS, and click the 4th column handlersSet the width of the selected columns to
1.5inin the Property inspector
Expand to watch setting last columns widths in action
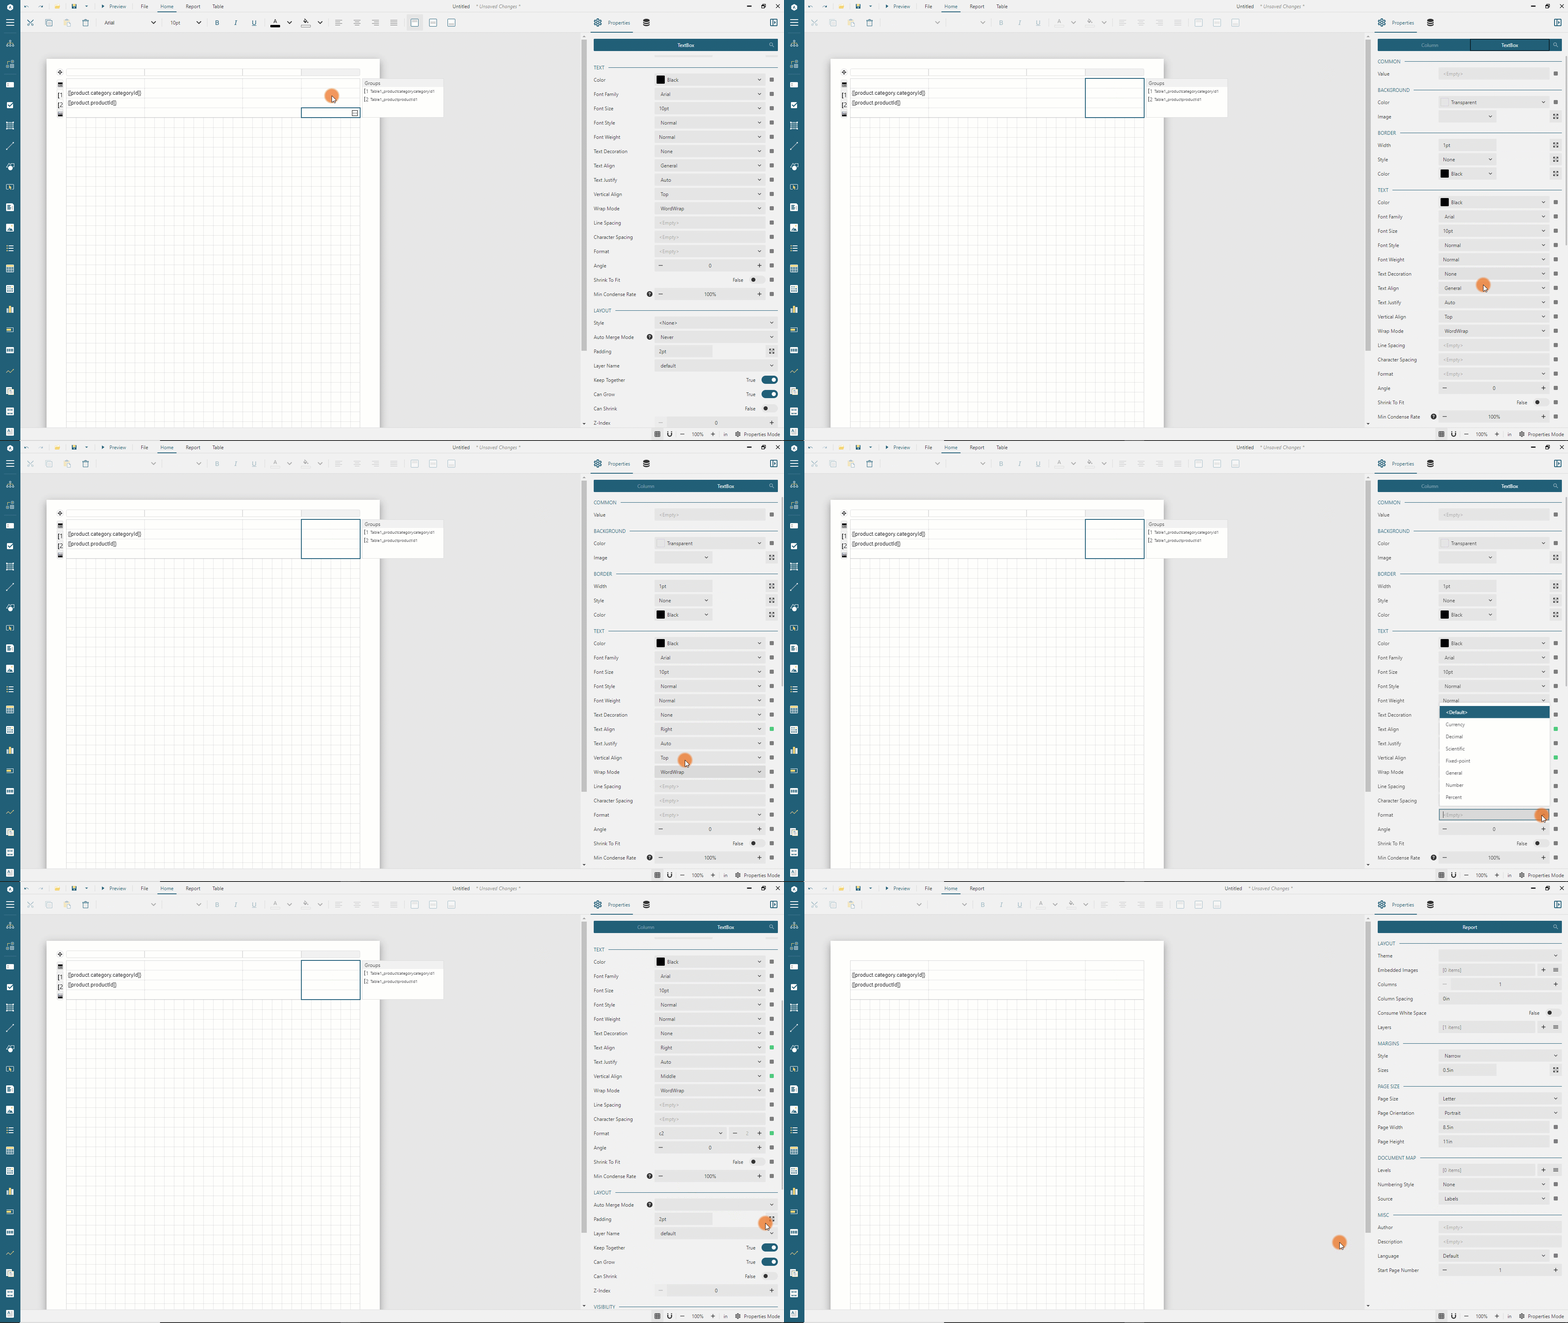
Switch to the TEXTBOX tab in the Property inspector. You can now modify the properties of all the table cells of a selected column.
Click the first column handler
Set the
Text Alignproperty toLeftSet the
Vertical Alignproperty toMiddleExpand the
Paddingeditor using the icon on its right side and set theLeft Paddingproperty to16pt
In the same manner, set the following properties for other columns cells:
Property | 2nd column | 3rd column | 4th column |
|---|---|---|---|
Padding | Left = 8pt | Right = 8pt | Right = 16pt |
Vertical Align | Middle | Middle | Middle |
Text Align | Default(Left) | Right | Right |
Format | Default(Empty) | Default(Empty) | Currency |
Expand to watch formatting of the last column in action
Configuring Column Headers
We use the table header row to display headers for displayed fields:
Double click the first cell of the first table row and type
CategoryDouble click the second cell of the first table row and type
ProductDouble click the third cell of the first table row and type
Quantity SoldDouble clock the 4th cell of the first table row and type
Sales AmountClick the first row handler and set its
Heightto0.5inin the Property inspectorSwitch to the
TEXTBOXtab in the Property inspector. You can now modify the properties of all the cells of the selected rowSet the
Background Colorproperty to#f7f7f7Expand the
Border Styleeditor using the icon on its right side and set theTop Border StyleandBottom Border Styleproperties toSolidSet the
Border Colorproperty to#e6e6e6Set the
Text Colorproperty to#3da7a8, and theFont WeighttoBold
Note: this step and the next three ones are very similar to formatting columns in the previous step, so we don't show the animation here. You can review the one on the last step to watch how rows and columns formatting in action.
Configuring Category Group Header
The table will generate one group header row, marked with the [1 icon, per each product category. We now format this row and add summary values for quantity and sales amount per category.
Click anywhere inside the table to display the columns and rows handlers
Click the second row handler
Switch to the
ROWtab in the Property inspectorSet the
Heightproperty to0.4inSwitch to the
TEXTBOXtab in the Property inspector. You can now modify the properties of all the cells of the selected rowSet the
Border Widthproperty to0.25ptExpand the
Border Styleeditor using the icon on its right side and set theBottom Border Styleproperties toSolidSet the
Border Colorproperty to#e6e6e6Click the field selector of the first cell of the second row and choose the
{[product.category.categoryName]}item in the drop-down menuDouble click the third cell of the second row and type
{Sum(quantity)}Double click the 4th cell of the second row and type
{Sum(salesAmount)}
Configuring Product Group Header
The table will generate one group header row, marked with the [2 icon, per each product within a given category. We now format this row and add summary values for quantity and sales amount per product.
Click anywhere inside the table to display the columns and rows handlers
Click the third row handler
Switch to the
ROWtab in the Property inspectorSet the
Heightproperty to0.4inSwitch to the
TEXTBOXtab in the Property inspector. You can now modify the properties of all the cells of the selected rowSet the
Border Widthproperty to0.25ptExpand the
Border Styleeditor using the icon on its right side and set theBottom Border Styleproperties toDottedSet the
Border Colorproperty to#e6e6e6Double click the first cell of the third row and remove the existing text
Click the field selector of the second cell of the third row and choose the
{[product.productName]}item in the drop-down menuDouble click the third cell of the third row and type
{Sum(quantity)}Double click the 4th cell of the third row and type
{Sum(salesAmount)}
Configuring Table Footer
We will use the table footer to show the grand total values for quantity and sales amount across the table.
Click anywhere inside the table to display the columns and rows handlers
Click the 4th row handler
Switch to the
ROWtab in the Property inspectorSet the
Heightproperty to0.5inSwitch to the
TEXTBOXtab in the Property inspector. You can now modify the properties of all the cells of the selected rowSet the
Background Colorproperty to#f7f7f7Expand the
Border Styleeditor using the icon on its right side and set theTop Border Styleproperties toSolidSet the
Border Colorproperty to#e6e6e6Set the
Font Weightproperty toBoldDouble click the third cell of the 4th row and type
{Sum(quantity)}Double click the 4th cell of the 4th row and type
{Sum(salesAmount)}
Adding Table Header
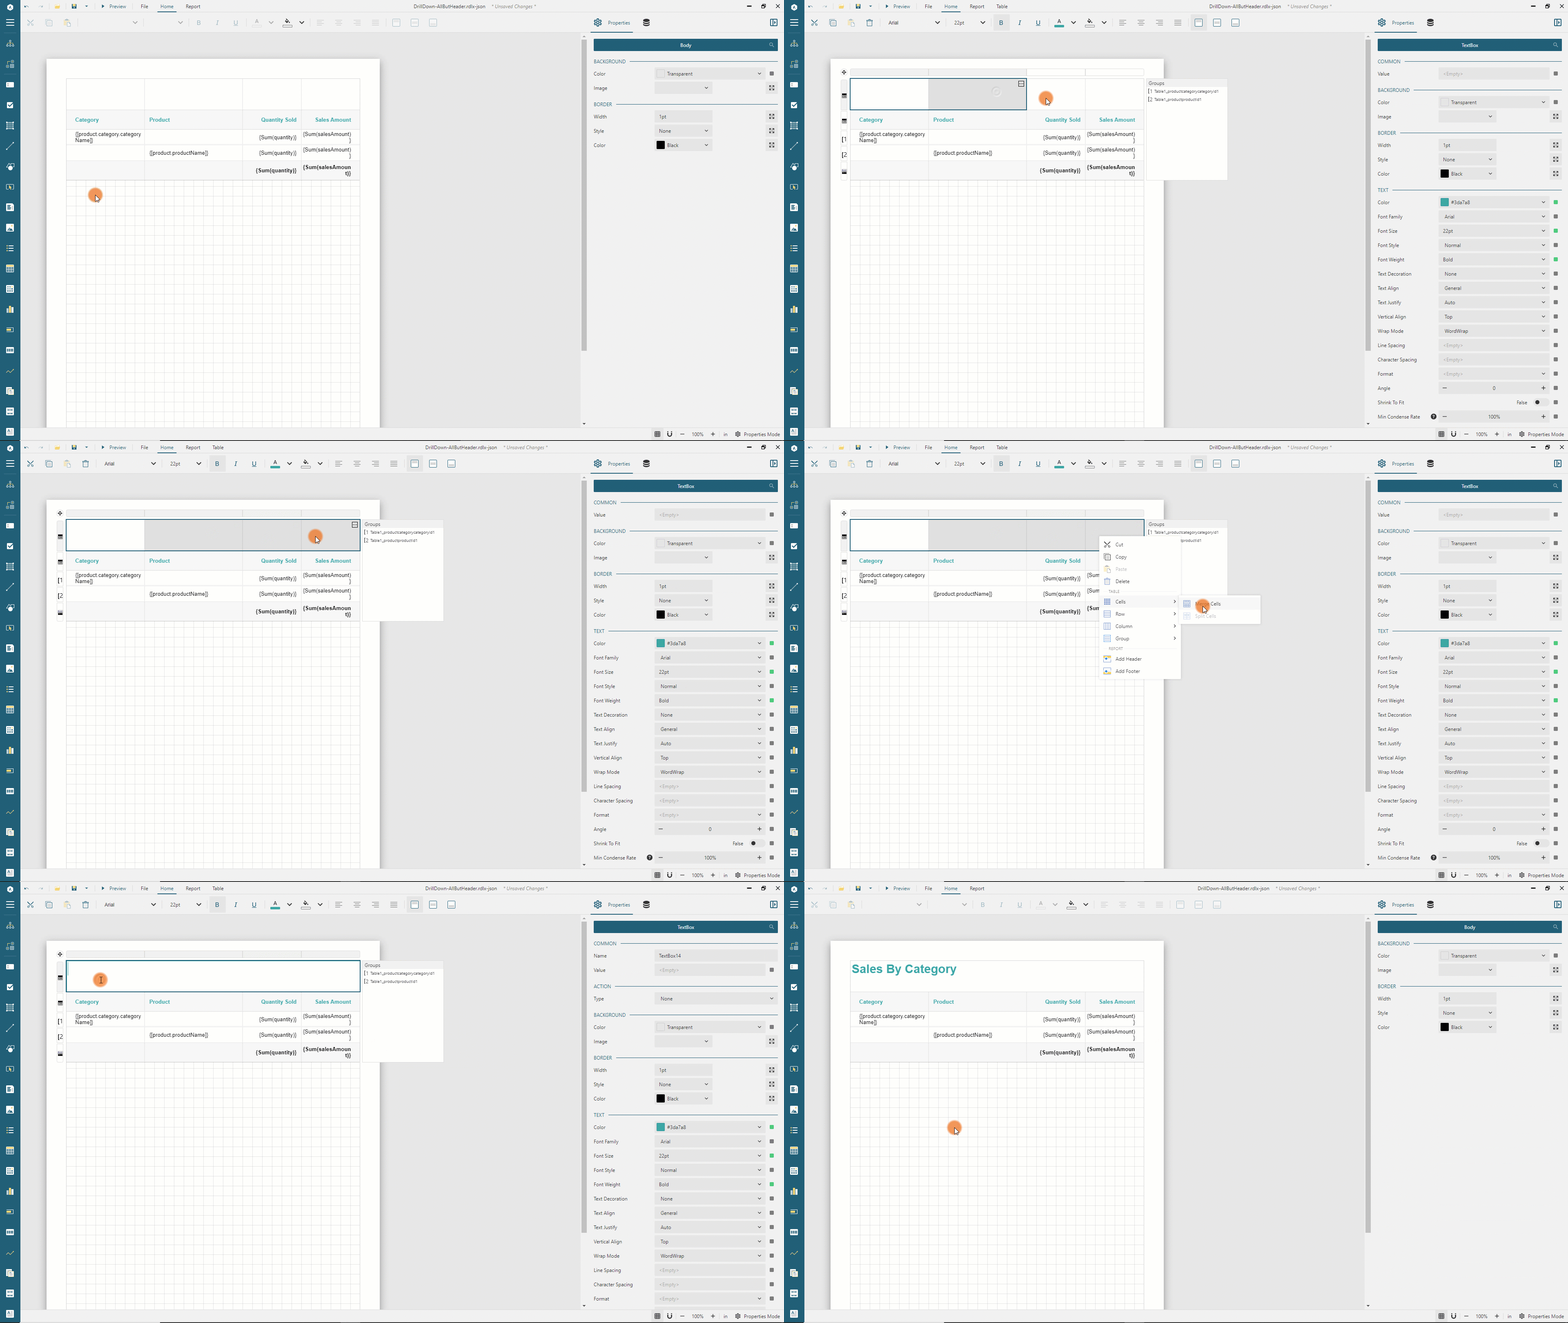
We now add one more table header row to display a heading text.
Click anywhere inside the table to display the columns and rows handlers
Right click the first row handler and select the
Row > Insert Row Aboveitem the drop-down menuClick the handler of the newly selected row and set its
Heightproperty to0.8ptin the Property InspectorSwitch to the
TEXTBOXtab in the Property inspectorSet the
Text Colorproperty to#3da7a8,Font Sizeto22pt,Font WeighttoBold, and theVertical AligntoMiddleExpand the
Paddingeditor using the icon on its right side and set theLeft Paddingproperty to16ptClick the first cell of the first row, press the
Ctrlbutton on Windows orCmdon Mac OS, and click the 2nd, 3rd, and 4th cells on the same rowRight click on the selection and select the
Cells > Merge Cellsitem in the drop-down menu. The row now has a single cell that occupies four columnsDouble click the merged cell and type
Sales By Category
Expand to watch cell merging and setting the table header text in action
Adding Drill Down
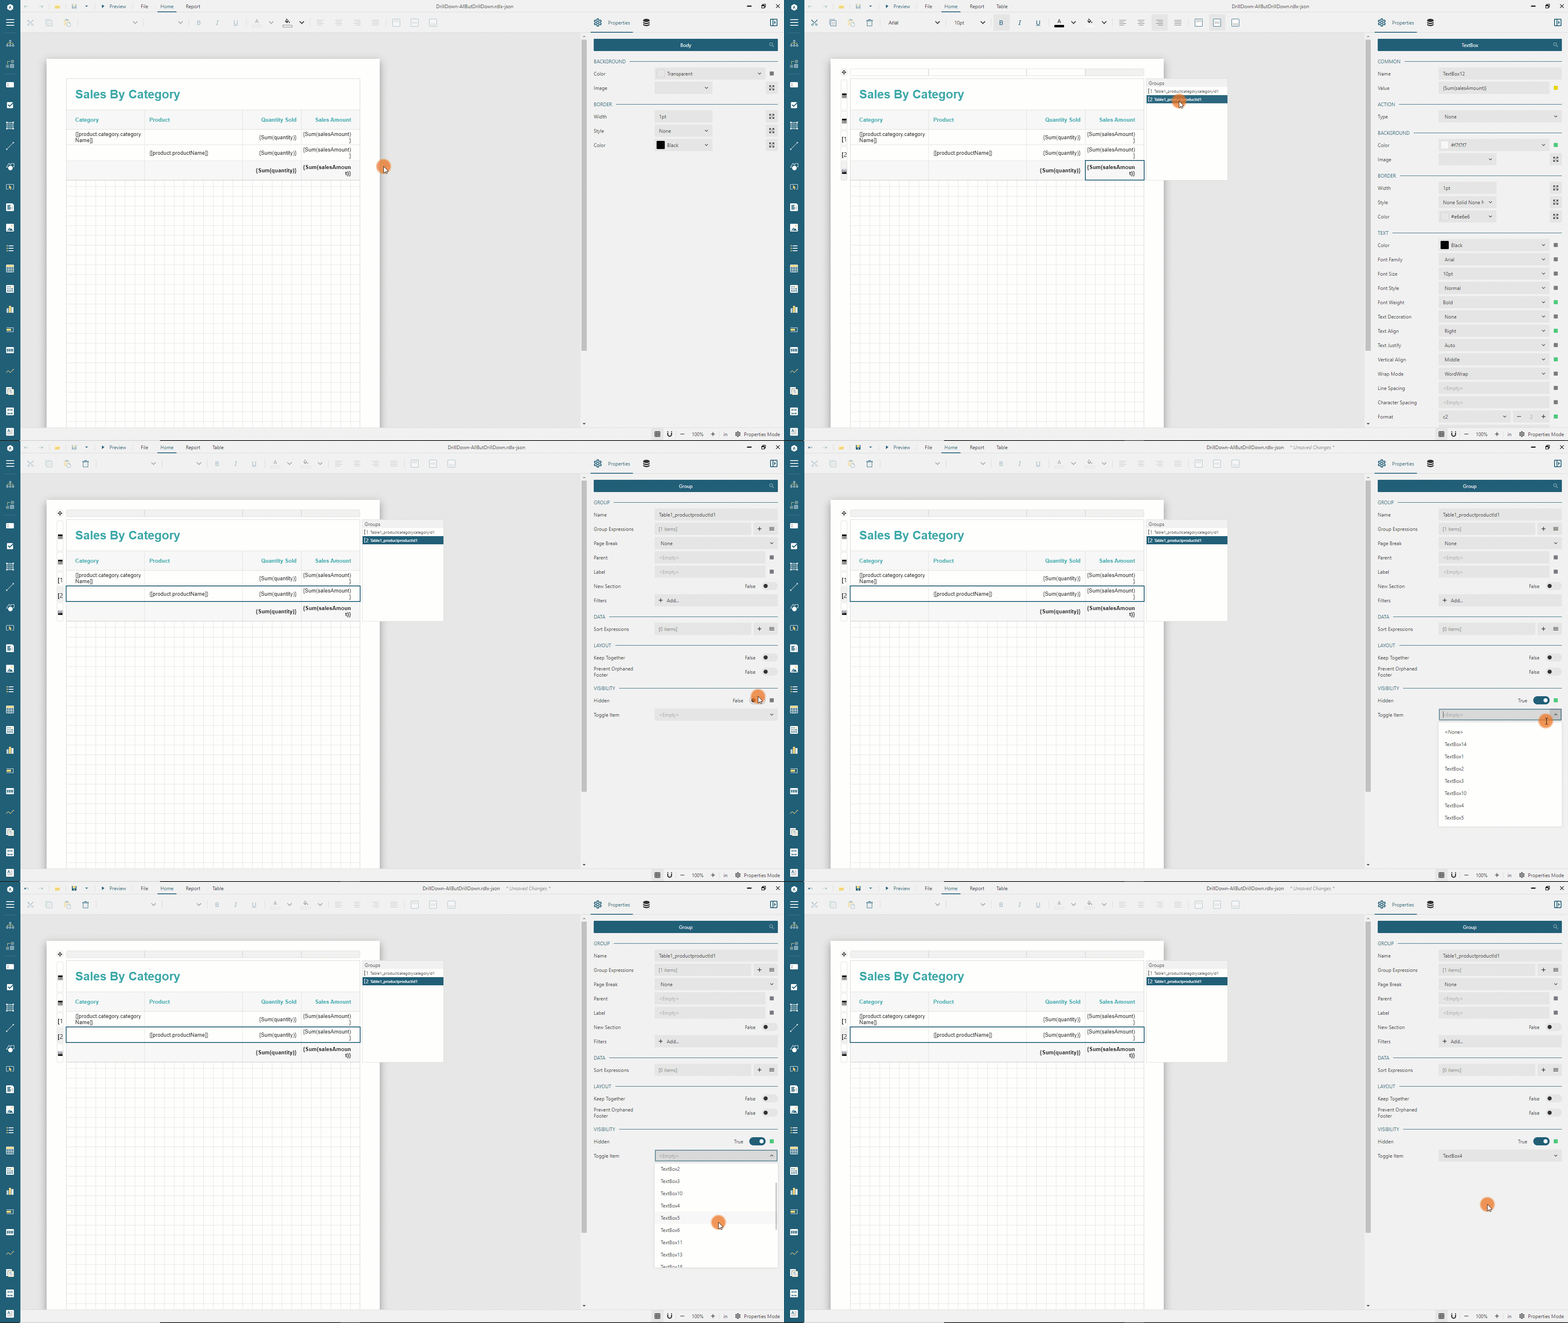
The report we are building should display sales by category by default and allow the report reader to expand the category to explore sales by product within the given category. We could achieve such an outcome by setting the dynamic visibility of the Product grouping:
Click anywhere inside the table to display the group editor
Click the
[2 Table1_productproductId1in the list of groupsSet the
Hiddenproperty toTrueSelect the
TextBox4in theToggle Itemdrop-down.TextBox4displays the category name. As the result of this setup, the Product group instances will dynamically show and hide if a report reader clicks the expand or collapse icon that appears near each category.
Expand to watch setting drill down in action
Using the Galley Mode for Preview
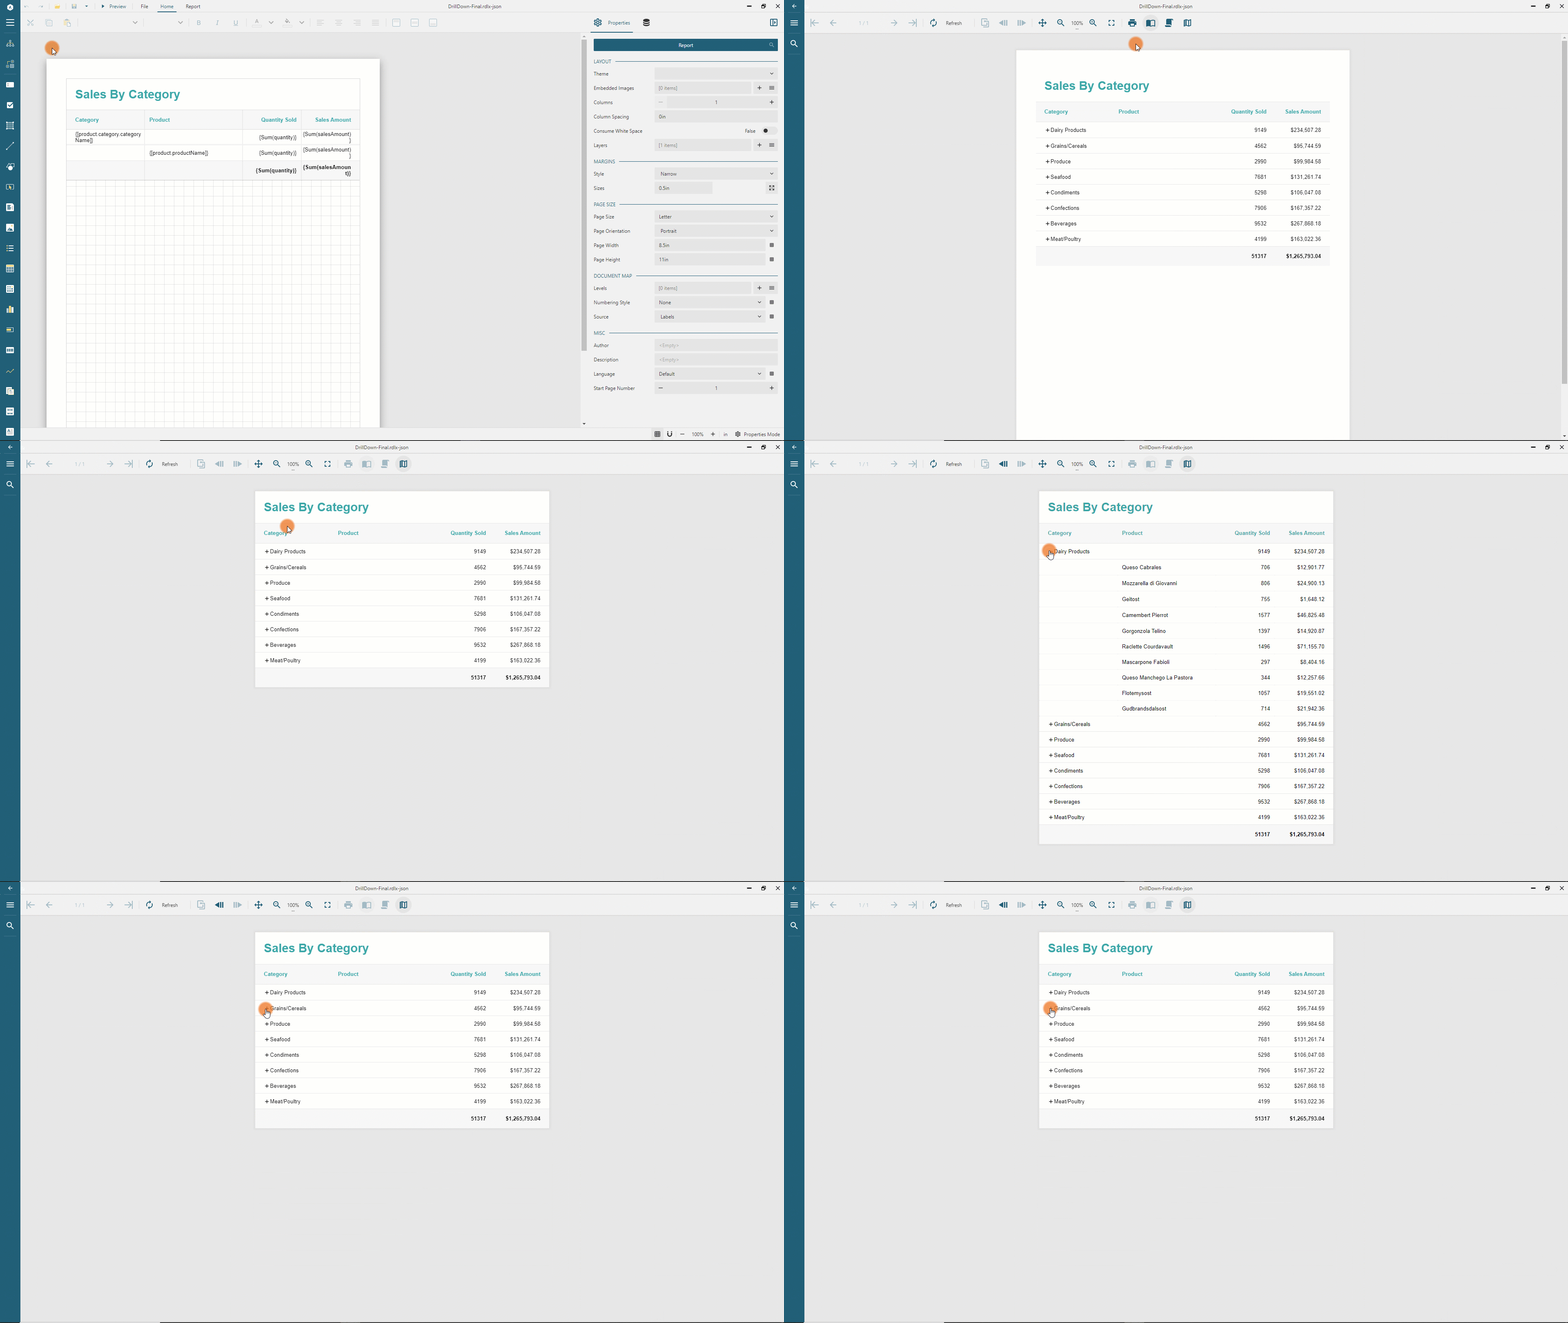
You can now preview the report output and expand collapse product categories using the + icon on the left side of a category name. You can click the rightmost button, called Galley Mode, on the report viewer toolbar. This button switches the viewer mode to display the unpaginated output that is suitable for reading drill-down reports.
Expand to watch report preview in Galley Mode in action
The final version of report is available at the demo web-site.
Feedback
Submit and View Feedback For
- Introduction
- Prerequisites
- Creating a New Report
- Data Binding
- Adding Data Source
- Adding Data Set
- Adding Table Data Region
- Setup Hierarchical Table Grouping
- Formatting Table Columns
- Configuring Column Headers
- Configuring Category Group Header
- Configuring Product Group Header
- Adding Table Header
- Adding Drill Down
- Using the Galley Mode for Preview


