
Chart Elements
The FlexChart is composed of elements that can be customized using its object model. The elements are:
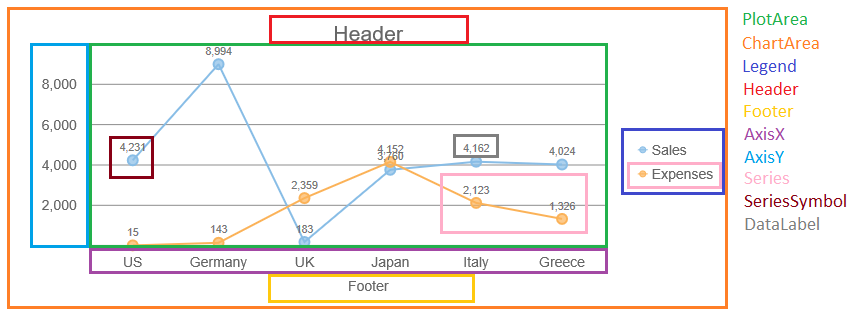
- PlotArea: The area within the axes.
- ChartArea: The area within the control but outside the axes.
- Legend: The chart legend, usually on the right of the plot area.
- Header: The chart header, above the plot area.
- Footer: The chart footer, below the plot area.
- AxisX: The X-axis, usually horizontal.
- AxisY: The Y-axis, usually vertical.
- Series: A collection of Series objects that can be used to customize the chart. The FlexChart populates the series collections automatically based on the chart's itemsSource.
- SeriesSymbol: A symbol in a chart series.
- DataLabel: A label attached to a data point.
Extra Chart Elements
In addition to the regular chart, you can add extra elements to the chart in several ways:
- events: Use the rendering and rendered events to add arbitrary elements behind or in front of the regular chart elements. For more details, see Events.
- annotations: Use the wijmo.chart.annotation extension to add annotations (shapes or text) to data points or to chart areas. For more details, see Annotations.
- analytics: Use the wijmo.chart.analytics extension to add trendlines and moving averages to the chart. For more details, see Trend Lines.
- plotAreas: Use the plotAreas property to add multiple plot areas to the chart, using the same header, footer, legend, and sharing axes. For more details, see Plot Areas.