Template Properties
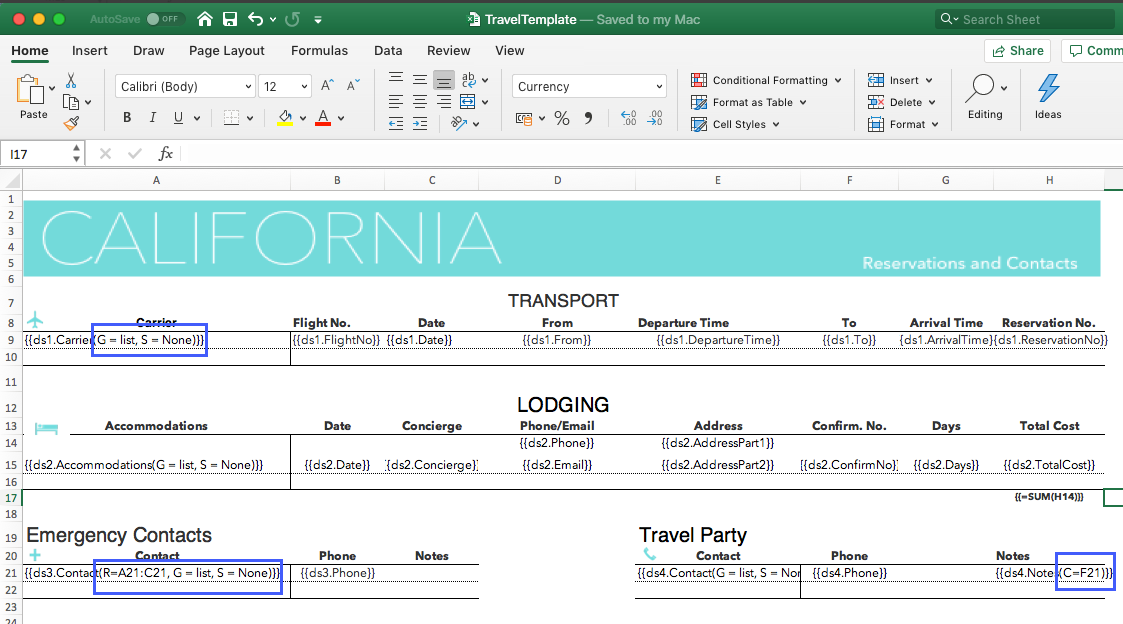
The template properties are defined along with template fields in round braces ( ) as can be seen in the below image:
Cell Context
The cell context property defines the relationship between cells depending on which the cells are grouped or filtered.
Value: Cell location or Data field
Custom: Cell context must be specified explicitly.
Default (default value): The adjacent cell on the left with E=V, or the adjacent cell on the top with E= H.
None: The cell has no context.
Example
{{ds.field(C=A1, E=H)}}
Hello World! {{(C=A2)}}
{{=SUM(F4) (C=ds1.team)}}
{{=SUM(ds1.score) (C=ds1.team*ds1.season)}}
For more information about Cell Context, refer Cell Context topic.
Cell Expansion
The cell expansion property describes the direction in which the cell values will expand.
Value: Enum
E=N (None)
E=H (Horizontal): Cell data is expanded from left to right.
E=V (Vertical-Default value): Cell data is expanded from top to bottom.
Example
{{ds.field(C=A1, E=H)}}
For more information about Cell Expansion, refer Cell Expansion topic.
Group
The group property allows you to group data in template.
Value: Enum
G=Normal: The group by field(s) value is not repeated for the corresponding records in the column; instead they are printed once per data group.
G=Merge (default value): The same behavior as for the normal parameter, except that it merges the cells in the group by field(s) for each group set.
G=Repeat: The group by field(s) value is repeated for the corresponding records.
G=List: The field(s) values are listed independently for the corresponding records.
Example
{{ds.field(G=repeat)}}
{{ds.field(G=list)}}
The below image shows how to apply 'merge' grouping on repeating data. You can also download the Excel template layout used in below example.

Range
The range property specifies the fallback context for the fields in specified range. All the fields that are covered in the range which have no default nor explicit context, use the current cell in which the range is defined, as their context.
Value: Cell range
Default value: Null
Example
{{ds.field(R= B3:F10)}}
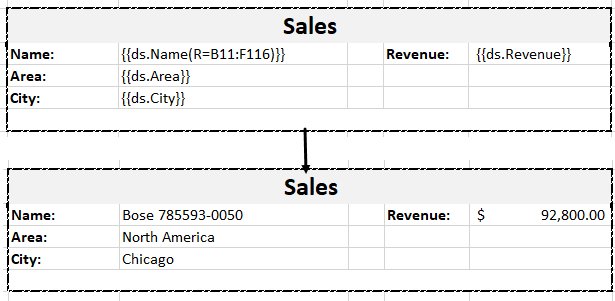
The below image shows that the range is defined for a student name, specifying that the details will expand and group with respect to Student name. You can also download the Excel template layout used in below example.
Sort
The Sort property ('S') defines the sorting type within the template. This property applies to a single or multiple columns, determined by the respective cell values. The sorting functionality extends beyond sorting in ascending and descending order; it allows the application of custom sorting rules to single or multiple columns.
DsExcel implements sorting by observing the following basic rules:
DsExcel processes the sort function of a template by distinguishing the cells into template cells and instance cells. Template cells are the cells in the template file, while instance cells are the cells that are created after the template has been processed.
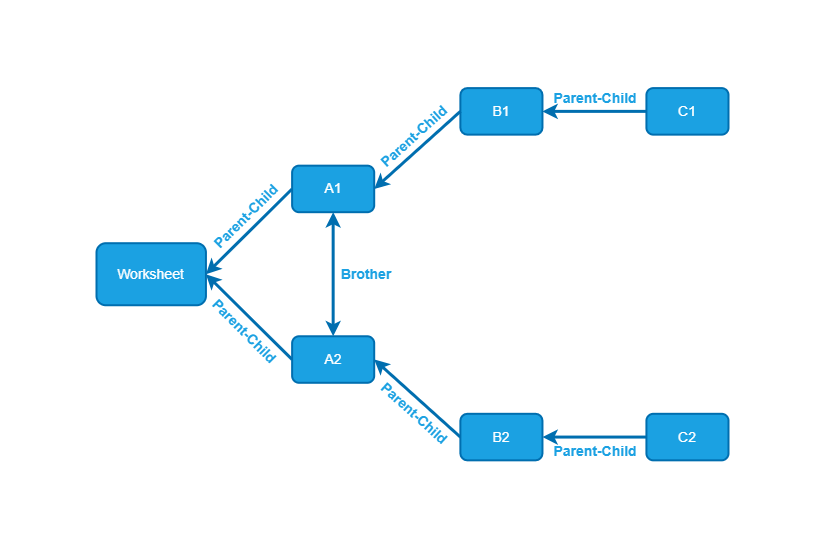
DsExcel treats the relationship between the template cells as a parent-child relationship. A similar relationship applies between the instance cells.
DsExcel sorts the cells between brother instance cells but cannot change the parent-child relationship. Hence, the instance cells to be sorted must fulfill the following two conditions:
They come from the same template cell.
They have a common parent cell.
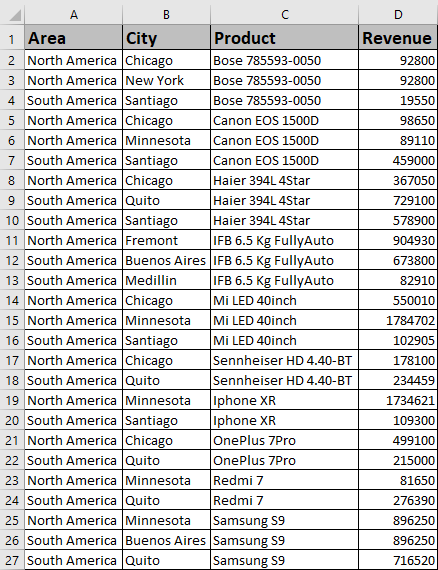
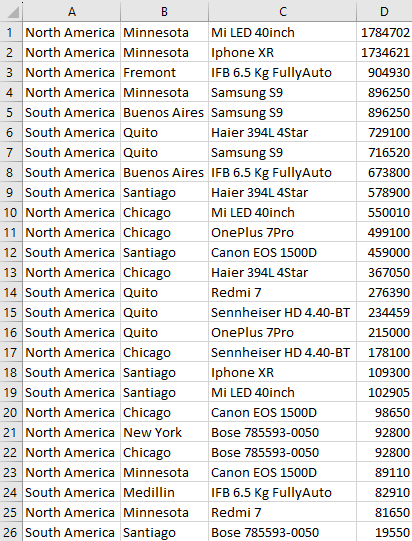
For example, let's consider the following data source:
If you use the following template, the cells in column D cannot be sorted because the Sort property is restrained by context cell A1 (i.e., no common parent cell).

Hence, you can only add the Sort property to cell A1. Then the template will be as follows:

Result:
You can only sort cells that have the Sort property; cells without the Sort property will not be sorted. This means that in the above data source, sorting the value of A1 based on the value of D1 will only sort A1, not D1.
Sorting can be performed in three ways:
Enum
Array
Expression
Value: Enum
S=Asc (default value): Ascending
S=Desc : Descending
S=None: None
Value: Array
S={“X“, “Y“,”Z”}
Value: Expression
S=(Cell A Asc {“X“, “Y“,”Z”}, Cell B Desc)
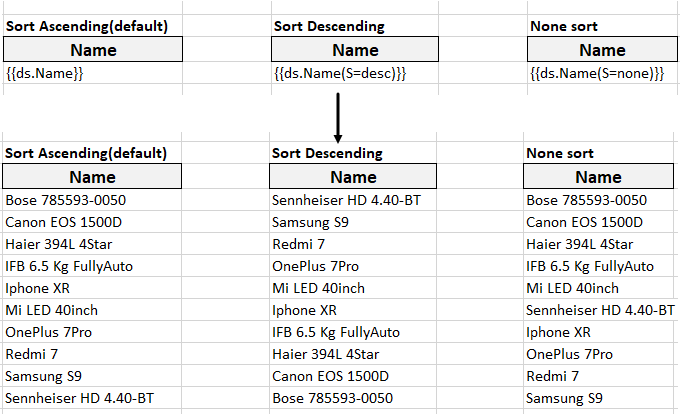
Example 1: Sorting Single Column
{{ds.field(S=Desc)}}
The below image shows how the template fields are expanded based on their sorting type. You can also download the Excel template layout used in below example.
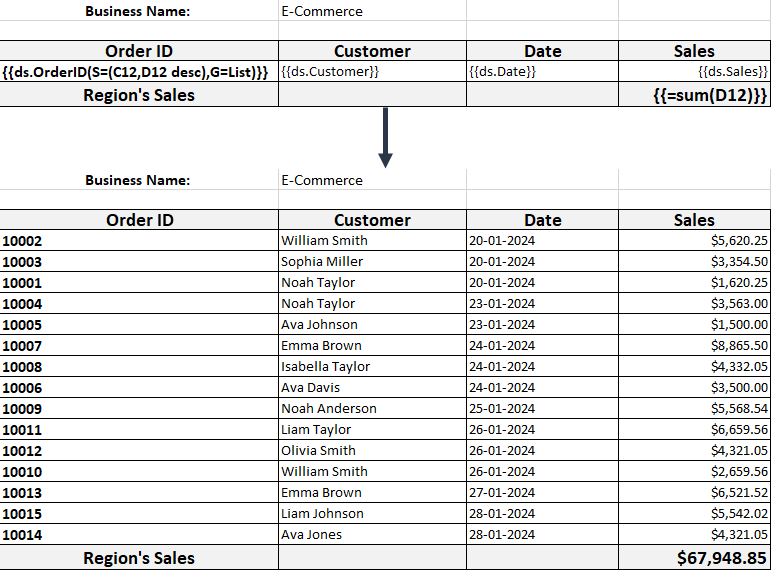
Example 2: Sorting Multiple Columns
{{ds.OrderID(S=(C12,D12 desc),G=List)}}
The below image shows how the Order ID column is sorted based on C12 and D12 cells. You can also download the Excel template layout used in below example.
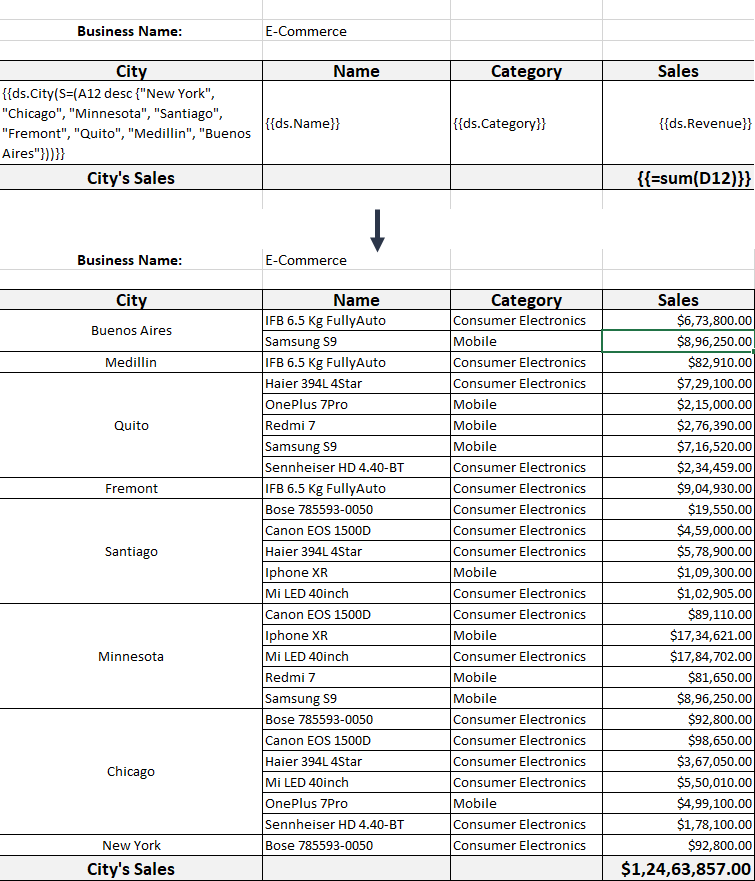
Example 3: Sorting using Custom Rule
{{ds.City(S=(A12 desc {"New York", "Chicago", "Minnesota", "Santiago", "Fremont", "Quito", "Medillin", "Buenos Aires"}))}}
The below image shows how the City column is sorted based on custom sorting rule. You can also download the Excel template layout used in below example.
Filter
The Filter property ('F') allows you to set the type of filtering within the template. This property provides two types of filtering options: Conditional and Slice filters. You can use these filter options individually or in combination to filter data from the table. This property can filter data from single or multiple tables for report generation.
DsExcel supports Filter property only with regular data sources, such as System.Data.DataTable or ITableDataSource.
!type=note
Note: You can apply filters to JSON data sources by creating a custom data table. For more information, refer to Custom Data Table.
Conditional Filter
Conditional Filter filters the data using operators and keywords such as AND, OR, NOT, and LIKE. The LIKE keyword and comparison operators have the highest priority and will be evaluated first. For the remaining keywords, the priority is: NOT > AND > OR. Furthermore, using paired parentheses allows customization of the order of operations for these operators and keyword evaluations.
Value: Expression
F/Filter = (field1 > 1 AND field2 = 2 OR field3 <> 3)
The following table lists the operators and keywords that Conditional Filter supports:
Operator/Keyword | Operator/Keyword Supported | Sign | Description |
|---|---|---|---|
Operator | Less than | < | Filters value less than the given value. |
Less than or equal to | <= | Filters value less than or equal to the given value. | |
Greater than | > | Filters value greater than the given value. | |
Greater than or equal to | >= | Filters value greater than or equal to the given value. | |
Equal to | = | Filters value equal to the given value. | |
Not equal to | <> | Filters value not equal to the given value. | |
Keyword | And | AND | A logical operator to combine multiple conditions in a query. It returns true if both conditions are true. For example: {{ds2.amount(F = (ds2.amount < 500 and ds2.age < 18))}} |
Or | OR | A logical operator to combine multiple conditions in a query. It returns true if at least one of the conditions is true. For example: {{ds2.amount(F = (ds2.amount < 500 or ds2.age < 18))}} | |
Not | NOT | A logical operator to negate a condition in a query. It returns true if the condition is false, and false if the condition is true. For example: {{ds2.amount(F = (not ds2.amount < 500 or not ds2.age < 18))}} | |
Like | LIKE | A keyword for pattern matching operations. The following two wildcards are available to use in conjunction with the LIKE operator:
For example: {{ds2.name(F = (ds2.name like \"*wh?te?\"))}} Use ~* and ~?, respectively, to match the character * or ? Use ~* and ~?, respectively, to match the character * or ? with themselves. |
!type=note
Note: The left operand in the filter condition must be the field in the current table, while the right operand can be any constant, field in the current table, or a reference field in another table.
Example 1: Filter using Operator
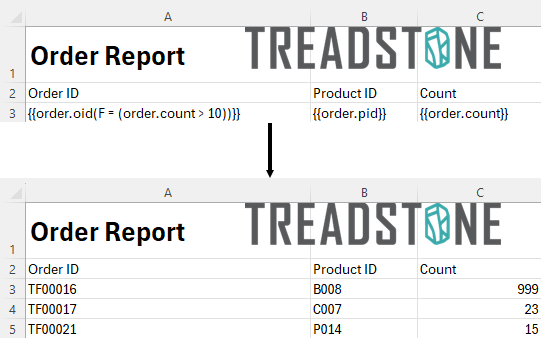
{{order.oid(F = (order.count > 10))}}
The below image shows how the template generates a report by filtering orders whose sales count is greater than 10. You can also download the Excel template layout used in the below example.
You can also view the demo to learn more about Fitler using Operator.
Example 2: Filter using Keyword
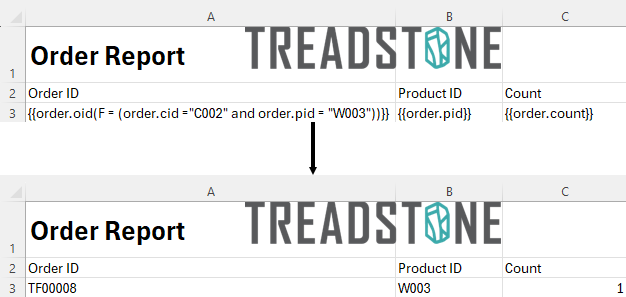
{{order.oid(F = (order.cid ="C002" and order.pid = "W003"))}}
The below image shows how the template generates a report by filtering orders where Customer ID is "C002" and Product ID is "W003." You can also download the Excel template layout used in the below example.
You can also view the demo to learn more about Fitler using Keyword.
Example 3: Simple Multi-Source Report
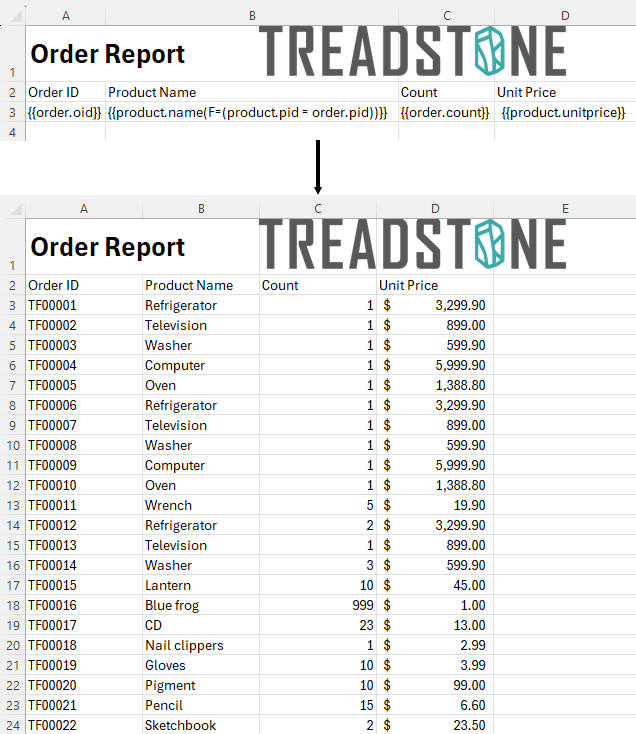
{{product.name(F=(product.pid = order.pid))}}
The below image shows how the template generates a report by filtering Product Name using product IDs from different data tables. You can also download the Excel template layout used in the below example.
You can also view the demo to learn more about Simple Multi-Source Report.
Example 4: Complex Multi-Source Report
Customer Name | Product Name |
|---|---|
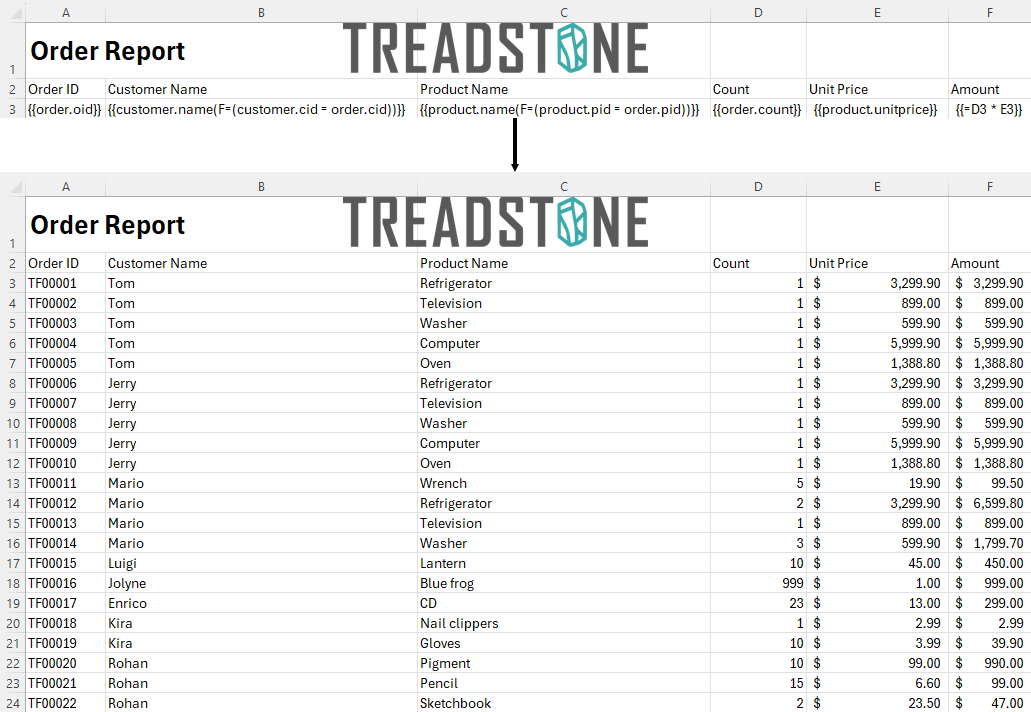
{{customer.name(F=(customer.cid = order.cid))}} | {{product.name(F=(product.pid = order.pid))}} |
The below image shows how the template generates a report by filtering Customer and Product names using customer and product IDs from different data tables. You can also download the Excel template layout used in the below example.
You can also view the demo to learn more about Complex Multi-Source Report.
Slice Filter
Slice Filter filters the data by taking data from one given index to another given index.
Value: Array
F/Filter = [start:stop:step]
The start refers to the index from which the filter will begin, whereas the stop refers to the end of the filter. You can also define a step that allows you to provide an interval between the indexes.
Example: Slice Filter
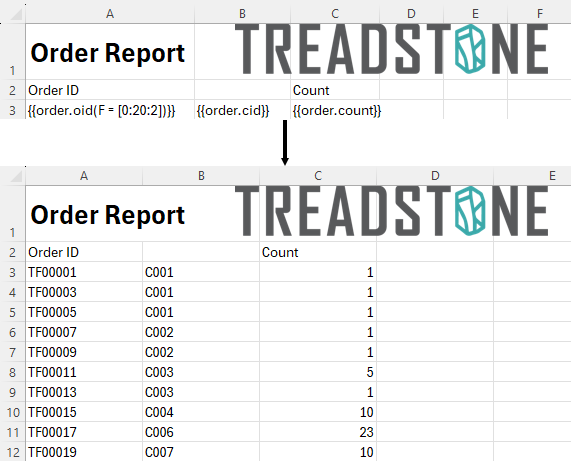
{{order.oid(F = [0:20:2])}}
The below image shows how the template generates a report by filtering first twenty odd orders. You can also download the Excel template layout used in the below example.
You can also view the demo to learn more about Slice Fitler.
Example: Slice Filter Reverse Operation
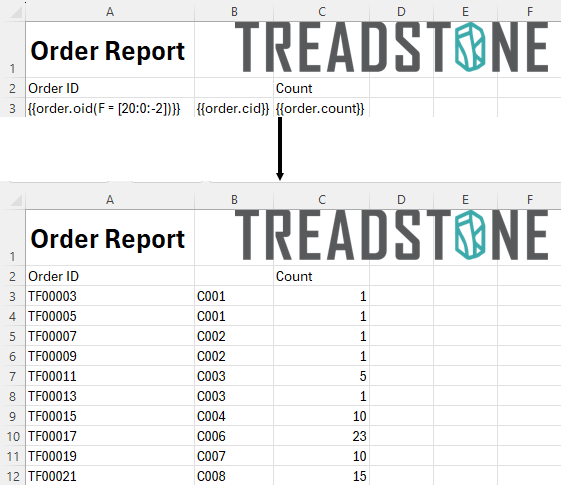
{{order.oid(F = [20:0:-2])}}
The below image shows how the template generates a report by filtering the last twenty orders from index 20. You can also download the Excel template layout used in the below example.
!type=note
Note: When iterating from the end of the records (reverse operation), the result will be in the original order. It is a limitation of DsExcel.
Combined Filter
You can use both the Conditional and Slice filters in combination to generate a report.
Example: Combined Filter
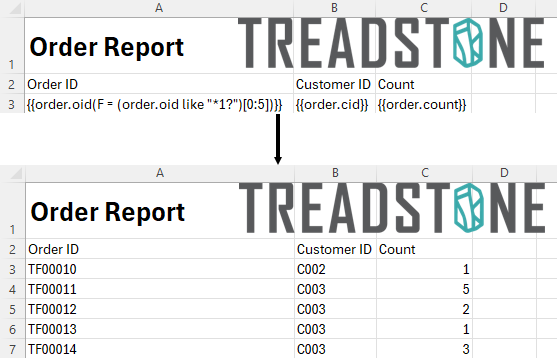
{{order.oid(F = (order.oid like "*1?")[0:5])}}
The below image shows how the template generates a report by first filtering the order ID that matches the expression "*1?" and then selecting the first five records from the filtered results. You can also download the Excel template layout used in the below example.
You can also view the demo to learn more about Combined Filter.
!type=note
Note: The slice filter and conditional filter can only appear zero or one time within a filter statement.
Page Break
The page break property specifies whether to add a new page after a field or not. It is determined by the location of the template cell in the generated report.
If the template cell in the generated report is located in the first row and the first column then no page break is added.
If the template cell in the generated report is located in the first column, horizontal page break is added.
If the template cell in the generated report is located in the first row, vertical page break is added
If the template cell in the generated report is located in any other location than the first row and first column, both horizontal and vertical page breaks area added
Value: Boolean
Pagebreak=True
Pagebreak=False (Default value)
Example
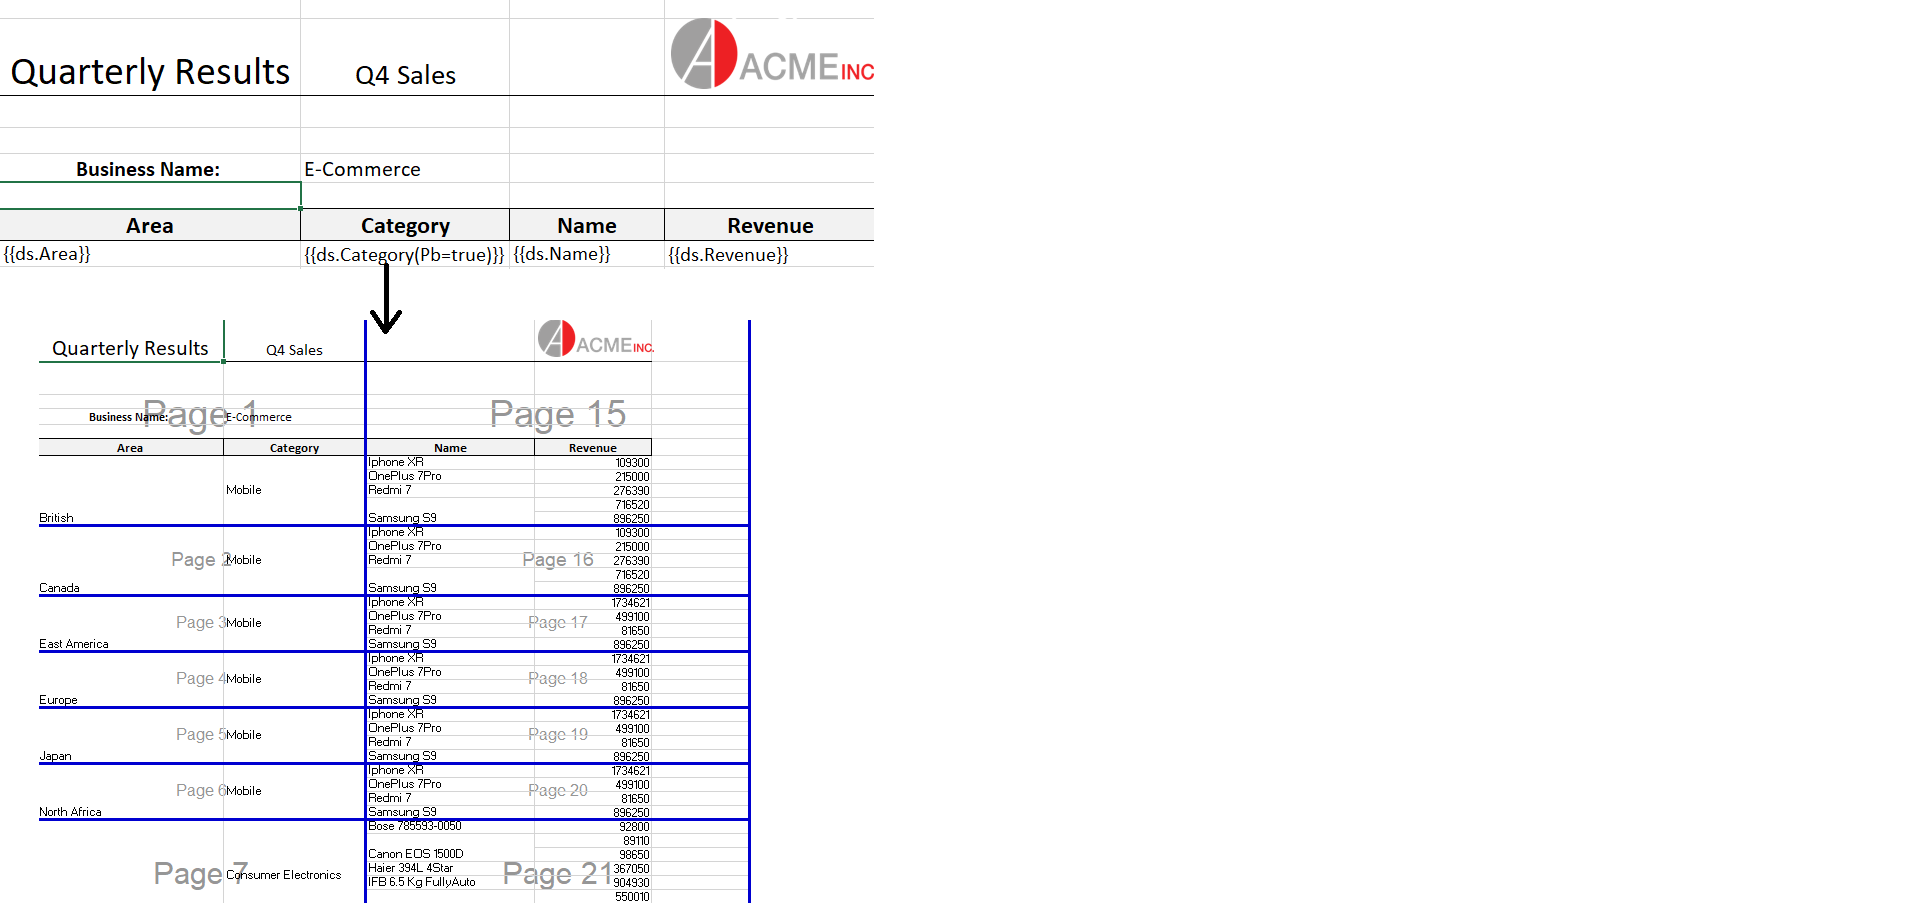
{{ds.field(Pagebreak=true)}}
The below image shows that a page break will be added after 'Category' field. You can also download the Excel template layout used in below example.
!type=note
Note: In pagination mode, the Pagebreak template property is ignored.
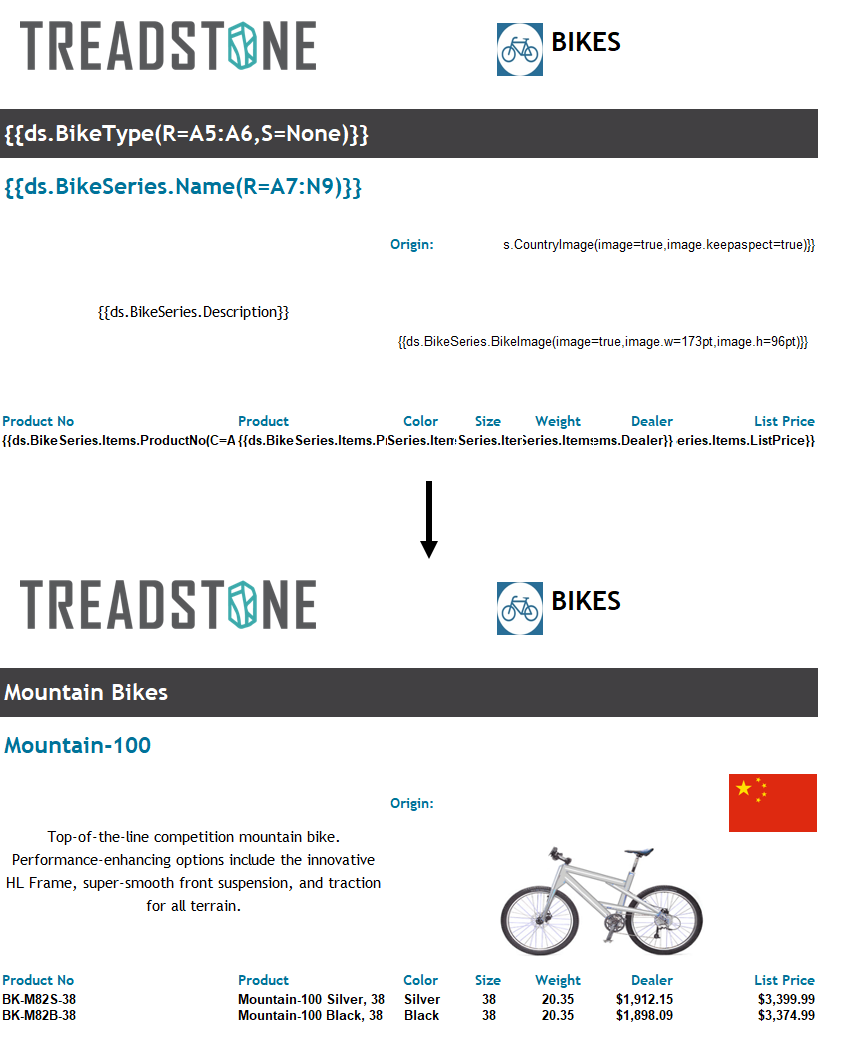
Image
The image property specifies whether or not to add an image. If the value is true, you can also specify the image width and height or maintain the aspect ratio.
The width and height specify the custom dimensions of an image in a cell, whereas keepaspect fits the image size to the cell size and maintains the aspect ratio as much as possible. When specifying width and height, you also need to specify the unit of the dimension, either pt or px.
The supported image data type is byte[] and base64 string.
The position of image in the cell can be controlled by setting the horizontal and vertical alignment style of cell. By default, the image is located in the center of the cell horizontally and vertically, both.
Value: Boolean
Image = True
Image= False (Default value)
Image.width=String value: Default value is cell width.
Image.height=String value: Default value is cell height.
Image.keepaspect= True
Image.keepaspect= False (Default value)
You can also use the following abbreviations: img, w, h, and ka for image, width, height, and keepaspect, respectively, to create the syntax.
!type=note
Note: Keepaspect takes precedence over width and height settings when you specify both properties of the image.
Example
{{ds.icon(Image=true)}}
{{ds.icon(Image=true, Image.width=150px)}}
{{ds.icon(Image=true, Image.height=150px)}}
{{ds.icon(Image=true, Image.keepaspect=true)}}
The below image shows how an image can be added in the Excel report. You can also download the Excel template layout used in below example.
For information regarding template properties related to pagination, see Pagination Properties and Functions.
!type=note
Note: All the above-mentioned template properties are case-insensitive, which means DsExcel ignores cases and matches values regardless of their lower or upper case letters.


