Inserting Charts
The data in C1FlexSheet can be visualized using Charts. To visualize the data in charts, you need to add data to a sheet in C1FlexSheet.
Follow the given steps in XAML to add data to a sheet and visualize it in chart:
Add the following namespace declaration in the Window tag:
xmlns:c1="http://schemas.componentone.com/winfx/2006/xaml"Copy the following code inside Grid tag to add C1FlexSheet control and a button control to insert a chart:
<Grid.RowDefinitions>
    <RowDefinition Height="Auto"/>
    <RowDefinition/>
</Grid.RowDefinitions>
<c1:C1FlexSheet Name="flex" Grid.Row="1" HorizontalAlignment="Left" VerticalAlignment="Top"/>
<Button Content="Insert Chart" Name="btnInsertchart" Click="btnInsertchart_Click" HorizontalAlignment="Left" Width="75"/>
Right-click Design view and select View Code from the context menu.
Add the following namespaces at the top:
Imports C1.WPF
Imports C1.WPF.FlexGrid
Imports C1.WPF.C1Chart
using C1.WPF; using C1.WPF.FlexGrid; using C1.WPF.C1Chart;Insert the following code directly below the InitializeComponent() method to add a sheet and data in it:
vbnet
'adding Sheet
flex.AddSheet("Sheet1", 50, 10)
' populate the grid with some formulas (multiplication table)
For r As Integer = 0 To flex.Rows.Count - 3
    Dim datas As New List(Of Double)()
    For c As Integer = 0 To flex.Columns.Count - 1
        flex(r, c) = String.Format("={0}*{1}", r + 1, c + 1)
        Dim value As Double = CDbl(flex(r, c))
        datas.Add(value)
    Next
csharp
//adding Sheet
flex.AddSheet("Sheet1", 50, 10);
// populate the grid with some formulas (multiplication table)
for (int r = 0; r < flex.Rows.Count - 2; r++)
{
    List<double> datas = new List<double>();
    for (int c = 0; c < flex.Columns.Count; c++)
    {
        flex[r, c] = string.Format("={0}*{1}", r + 1, c + 1);
        double value = (double)flex[r, c];
        datas.Add(value);
    }
}
Go back to the Design view and select Event handlers of btnInsertchart from the Properties windows.
Double-click the btnInsertchart_Click event handler.
The Code view will open again.
Add the following code to the btnInsertchart_Click event handler to insert a chart on button click:
 If Math.Abs(flex.Selection.RightColumn - flex.Selection.LeftColumn) > 0 AndAlso
    Math.Abs(flex.Selection.BottomRow - flex.Selection.TopRow) > 0 AndAlso
    flex.Selection.IsValid Then
     Dim c1Chart1 As New C1Chart()
     c1Chart1.Data.Children.Clear()
     For row As Integer = flex.Selection.TopRow To flex.Selection.BottomRow
         Dim datas As New List(Of Double)()
         For col As Integer = flex.Selection.LeftColumn To flex.Selection.RightColumn
             Dim value As Object = flex(row, col)
             If value IsNot Nothing AndAlso value.[GetType]().IsNumeric() Then
                 Dim cellValue As Double = CDbl(value)
                 datas.Add(cellValue)
             End If
         Next
         ' create single series for product price
         Dim ds As New DataSeries()
         'set data
         ds.ValuesSource = datas
         ' add series to the chart
         c1Chart1.Data.Children.Add(ds)
     Next

     ' add item names
     'c1Chart1.Data.ItemNames = ProductNames;
     ' Set chart type
     c1Chart1.ChartType = ChartType.Bar
     flex.InsertChart(c1Chart1)
 Else
     MessageBox.Show("Please select more data")
 End If
if (Math.Abs(flex.Selection.RightColumn - flex.Selection.LeftColumn) > 0
&& Math.Abs(flex.Selection.BottomRow - flex.Selection.TopRow) > 0
&& flex.Selection.IsValid)
{
C1Chart c1Chart1 = new C1Chart();
c1Chart1.Data.Children.Clear();
for (int row = flex.Selection.TopRow; row <= flex.Selection.BottomRow; row++)
{
List<double> datas = new List<double>();
for (int col = flex.Selection.LeftColumn; col <= flex.Selection.RightColumn; col++)
{
object value = flex[row, col];
if (value != null && value.GetType().IsNumeric())
{
double cellValue = (double)value;
datas.Add(cellValue);
}
}
// create single series for product price
DataSeries ds = new DataSeries();
//set data
ds.ValuesSource = datas;
// add series to the chart
c1Chart1.Data.Children.Add(ds);
}
// add item names
//c1Chart1.Data.ItemNames = ProductNames;
// Set chart type
c1Chart1.ChartType = ChartType.Bar;
flex.InsertChart(c1Chart1);
}
else
{
MessageBox.Show("Please select more data");
}Run the application.
Select a range of data in cells to display it in form of charts:
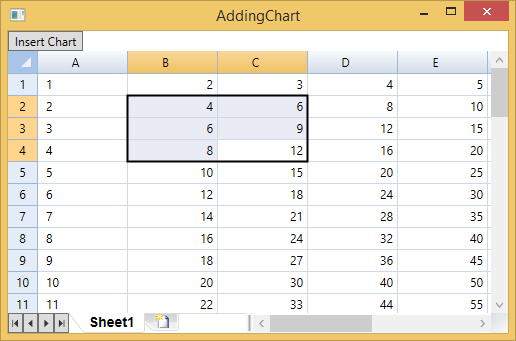
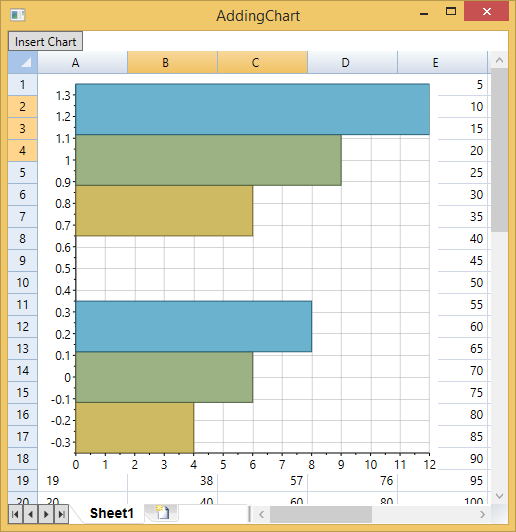
Click Insert Chart button.
The chart displayed on the basis of selected data looks similar to the image given below: