Adding Floor
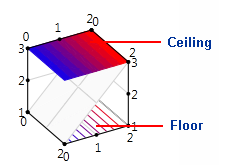
Chart3D for WPF and Silverlight allows you to give your charts a 2D representation by displaying contours and zones on the top, or ceiling, and bottom, or floor, of the plot cube of the chart.
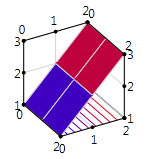
To determine the appearance of the floor, set the FloorAppearance property. In the following example, the XAML sets the FloorAppearance of a SurfaceZone chart to Contour.
<c1chart3d:C1Chart3D Height="150" HorizontalAlignment="Left" Margin="234,132,0,0" Name="c1Chart3D1" VerticalAlignment="Top" Width="200" ChartType="SurfaceZone" FloorAppearance="Contour">
        <c1chart3d:GridDataSeries ZDataString="1 1 1,2 2 2,3 3 3" />
</c1chart3d:C1Chart3D>
To determine the appearance of the ceiling, set the CeilAppearance property. In the following example, the XAML sets the CeilAppearance of a SurfaceContour chart to Zone.
<c1chart3d:C1Chart3D Height="150" HorizontalAlignment="Left" Margin="234,132,0,0" Name="c1Chart3D1" VerticalAlignment="Top" Width="200" ChartType="SurfaceContour" CeilAppearance="Zone">
    <c1chart3d:GridDataSeries ZDataString="1 1 1,2 2 2,3 3 3" />
</c1chart3d:C1Chart3D>
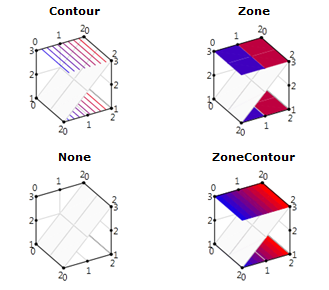
The FloorAppearance and CeilAppearance properties offer four appearance options: