
Setting Basic Line Graph
The following XAML shows how to declare the C1Chart control, set the ChartType, Theme, and Palette properties to define the basic chart appearance. The XAML can be added inside the … tags.
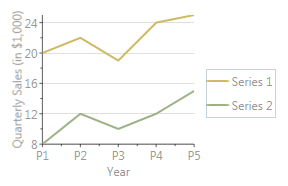
The following chart is produced using the following XAML code:
<Window x:Class="WpfApplication1.Window1"
  xmlns="http://schemas.microsoft.com/winfx/2006/xaml/presentation"
  xmlns:x="http://schemas.microsoft.com/winfx/2006/xaml"
  xmlns:c1="http://schemas.componentone.com/xaml/c1chart"
  Title="Window1" Height="300" Width="348" >
  <Grid>

    <!--Declare the C1Chart control
      Set the ChartType, Theme, and Palette properties to define the basic Chart appearance-->
    <c1:C1Chart
      Name="C1Chart1"
      ChartType="Line"
      Foreground="#a0000000"
      Background="#e0ffffff"
      Theme ="Vista"
      Palette ="Aspect" >

      <!--Define the chart View, which contains the chart axes.-->
      <c1:C1Chart.View>
        <c1:ChartView>

          <!-- Define the X axis (title, grid) -->
          <c1:ChartView.AxisX>
            <c1:Axis
              Title="Year"
              MajorGridStroke="Transparent"/>
          </c1:ChartView.AxisX>

          <!-- Define the Y axis (title, grid, annotation format) -->
          <c1:ChartView.AxisY>
            <c1:Axis
              Title="Quarterly Sales (in $1,000)"
              MajorGridStroke="#40000000"
              AnnoFormat="n0" />
          </c1:ChartView.AxisY>
        </c1:ChartView>
      </c1:C1Chart.View>

      <!--Define the chart Data, which contains the data series.-->
      <c1:C1Chart.Data>
        <c1:ChartData>

          <!-- ItemNames define the labels along the X axis -->
          <c1:ChartData.ItemNames>P1 P2 P3 P4 P5</c1:ChartData.ItemNames>

          <!--Each DataSeries specifies a label (shown in the legend) and the series data-->
          <c1:DataSeries Label="Series 1" RenderMode="Default" Values="20 22 19 24 25" />
          <c1:DataSeries Label="Series 2" RenderMode="Default" Values="8 12 10 12 15" />
        </c1:ChartData>
      </c1:C1Chart.Data>

      <!--Add a ChartLegend, docked to the right of the chart, to display
        a legend containing the series and their styles.-->
      <c1:C1ChartLegend DockPanel.Dock="Right" />
    </c1:C1Chart>
  </Grid>
</Window>