
-
Chart for WPF and Silverlight
- Getting Started
- Concepts and Main Properties
- Chart Types
-
Chart Features
- Animation
- Axis
- Chart Legend
- Chart View
- Data Binding
- Data Point Converter
- Data Labels
- Data Series 1
- Empty Values
- Grouping Aggregation
- Interaction
- Markers Labels
- Multiple Plot Areas
- Performance Optimization
- Plotting Functions
- Saving and Exporting C1Chart
- Series Generation
- Style and Appearance
- Time-Series Charts
- Trend Lines
- Tutorials
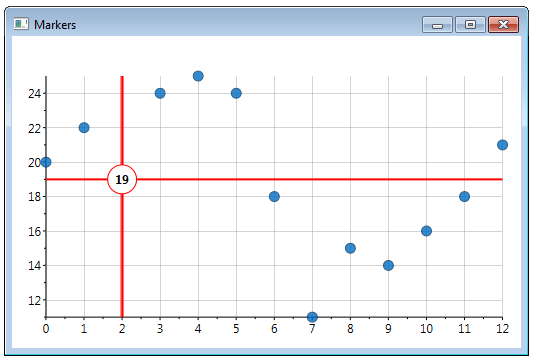
Crosshair Marker
For some charts, you might want a free-floating marker with a crosshair design to emphasize a data point. In this topic, you'll build on the line and dot marker by adding a horizontal marker as well. The completed chart with marker will resemble the following image:
In the XAML below, you'll set the DataPoint to NaN again:
<!-- crosshairs -->
<c1:ChartPanelObject x:Name="vline"
                     Attach="None"
                     Action="MouseMove"
                     DataPoint="-1, NaN"
                     VerticalContentAlignment="Stretch"
                     HorizontalAlignment="Center">
        <Border Background="Red" BorderBrush="Red" Padding="1" BorderThickness="1 0 0 0" />
</c1:ChartPanelObject>
<c1:ChartPanelObject x:Name="hline"
                     Attach="None"
                     Action="MouseMove"
                     DataPoint="NaN, -1"
                     HorizontalContentAlignment="Stretch"
                     VerticalAlignment="Center">
    <Border Background="Red" BorderBrush="Red" Padding="1" BorderThickness="0 1 0 0" />
</c1:ChartPanelObject>
<c1:ChartPanelObject x:Name="dot"
                     Attach="None"
                     Action="MouseMove"
                     DataPoint="0.5,0.5"
                     HorizontalAlignment="Center"
                     VerticalAlignment="Center">
    <Grid DataContext="{Binding RelativeSource={x:Static RelativeSource.Self},Path=Parent}">
        <Ellipse Fill="White" Stroke="Red" StrokeThickness="1" Width="30" Height="30" />
        <TextBlock x:Name="label" Text="{Binding DataPoint.Y, StringFormat=n0}" FontWeight="Bold" VerticalAlignment="Center" HorizontalAlignment="Center"/>
    </Grid>
</c1:ChartPanelObject>