
Using Sparkline in Microsoft DataGridView Control
This walkthrough explains the steps to show sparklines in Microsoft DataGridView control. The sparkline control cannot be directly added to the DataGridView cells but alternatively you can render it as an image in the DataGridView cells. To achieve the same, you first need to add an unbound DataGridViewImageColumn to the grid and then use the CellPainting event to render the Sparkline control as an image in the added unbound column. The walkthrough topic includes the following three steps.
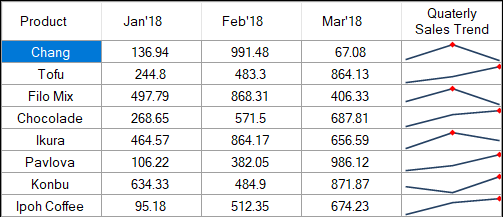
The following image shows the MS DataGridView control representing the C1Sparkline control in DataGridViewImageColumn.
Step 1: Add an MS DataGridView control
Create a new Windows Forms application. For more information on how to create an WinForms application, see Creating a Windows Forms Project topic.
Drag and drop DataGridView control from the Toolbox onto your form.
From the Properties window, set its Dock property to Fill.
Step 2: Create a Data Source
Create a DataTable using the following method ‘InitDataTable’. This DataTable will be used as the DataSource for the DataGridView.
private void InitDataTable() {
 _dataTable = new DataTable();
 _dataTable.Columns.Add("Product", typeof(String));
 _dataTable.Columns.Add("Jan'18", typeof(double));
 _dataTable.Columns.Add("Feb'18", typeof(double));
 _dataTable.Columns.Add("Mar'18", typeof(double));
 string[] productNames = {
  "Chang",
  "Tofu",
  "Filo Mix",
  "Chocolade",
  "Ikura",
  "Pavlova",
  "Konbu",
  "Ipoh Coffee"
 };
 Random random = new Random();
 for (int i = 0; i < productNames.Length; i++) {
  _dataTable.Rows.Add(new object[] {
   productNames[i], Math.Round(random.NextDouble() * 1000, 2), Math.Round(random.NextDouble() * 1000, 2), Math.Round(random.NextDouble() * 1000, 2)
  });
 }}
Step 3: Show Sparklines in DataGridViewImageColumn
Create a method named SetUpGrid to add an unbound DataGridViewImageColumn to the DataGridView control. This column is used for showing the sparkline as an image in the DataGridViewImageColumn.
Also subscribe to the CellPainting event. This event is used to render the sparklines in the grid initially. It is also used to re-render the sparkline at the time of resizing, sorting etc when the cell displaying the sparkline needs to be repainted.
private void SetUpGrid() {
 dataGridView1.DataSource = _dataTable;
 //Add an unbound DataGridViewImageColumn to the DataGridView. This column will be used to show the sparkline as an image
 DataGridViewImageColumn dataGridViewImageColumn = new DataGridViewImageColumn();
 dataGridViewImageColumn.Name = "Quaterly Sales Trend";
 dataGridViewImageColumn.HeaderText = "Quaterly Sales Trend";
 dataGridView1.Columns.Add(dataGridViewImageColumn);
 //Setting additional properties of the DataGridView (optional)
 dataGridView1.Font = new Font(FontFamily.GenericSansSerif, 9.5 f, FontStyle.Regular);
 dataGridView1.RowHeadersVisible = false;
 dataGridView1.AllowUserToAddRows = false;
 dataGridView1.DefaultCellStyle.Alignment = DataGridViewContentAlignment.MiddleCenter;
 dataGridView1.ColumnHeadersDefaultCellStyle.Alignment = DataGridViewContentAlignment.MiddleCenter;
 //Subscribe to the DataGridView's CellPainting event
 dataGridView1.CellPainting += DataGridView1_CellPainting;
}
To render the Sparkline control as an image in the DataGridViewImageColumn, use the DataGridView’s CellPainting event. In the CellPainting event handler, first create an image of the Sparkline control with the help of Control.DrawToBitmap method. Then, render the created image in the DataGridViewImageColumn cells using the Graphics.DrawImage method as shown below.
private void DataGridView1_CellPainting(object sender, DataGridViewCellPaintingEventArgs e) {
 if (e.RowIndex >= 0 && e.RowIndex < dataGridView1.Rows.Count && e.ColumnIndex == 4) {
  e.Handled = true;
  DataRow row = _dataTable.DefaultView.ToTable().Rows[e.RowIndex];
  //Initialize the Sparkline control
  C1Sparkline sparkline = new C1Sparkline();
  sparkline.Width = e.CellBounds.Width;
  sparkline.Height = e.CellBounds.Height;
  sparkline.BackColor = Color.White;
  sparkline.Styles.LineWeight = 1.6;
  //Add a marker to highlight the data point with the highest value.
  sparkline.ShowHigh = true;
  //Specify the Sparkline data
  List<double> values = new List < double > ();
  for (int i = 1; i <= 3; i++) {
   values.Add(Convert.ToDouble(row.ItemArray[i]));
  }
  sparkline.Data = values;
  //Render the sparkline to a bitmap
  Bitmap bitmap = new Bitmap(e.CellBounds.Width, e.CellBounds.Height);
  sparkline.DrawToBitmap(bitmap, sparkline.Bounds);
  //Draws the Sparkline image in the DataGridView cell
  e.Graphics.DrawImage(bitmap, new Point(e.CellBounds.X, e.CellBounds.Y));
  e.Paint(e.CellBounds, DataGridViewPaintParts.Border);
 }
}
Finally, call the InitDataTable and SetUpGrid methods in the Form1_Load event handler.
private void Form1_Load(object sender, EventArgs e) {
//Creates DataTable which will be used as the DataSource for the DataGridView
InitDataTable();
//Adds an unbound column to the DataGridView and sets the DataGridView properties
SetUpGrid();
}
Run the application. Observe that the sparkline control gets displayed in the ’Quarterly Sales Trend’ column of the MS DataGridView control.